Companies
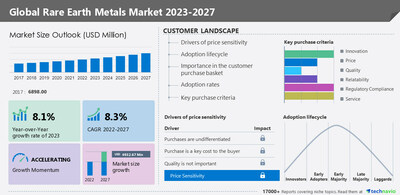
Technavio: Rare Earth Metals Market to Grow by 8.1% YoY in 2023
In 2017, the rare earth metals market was valued at $6,898M….

Rare earth metals insights –
- Vendors: 15+, including Alkane Resources Ltd, Arafura Rare Earths Ltd., Arnold Magnetic Technologies Corp., Avalon Advanced Materials Inc., Canada Rare Earth Corp, Energy Transition Minerals Ltd., Frontier Rare Earths Ltd., HEFA Rare Earth Canada Co. Ltd., Hitachi Metals Ltd., Iluka Resources Ltd., IREL (India) Ltd., Lynas Rare Earths Ltd., MONTERO MINING AND EXPLORATION LTD., Namibia Critical Metals Inc, Neo Performance Materials Inc., Northern Minerals Ltd., Rare Element Resources Ltd., Shin Etsu Chemical Co. Ltd., SHOWA DENKO K.K., Ucore Rare Metals Inc., among others
- Coverage: Parent market analysis; key drivers, major trends, and challenges; customer and vendor landscape; vendor product insights and recent developments; key vendors; and market positioning of vendors
- Segments: Application, Type, and Geography
To understand more about the rare earth metals market, request a sample report
In 2017, the rare earth metals market was valued at USD 6,898.00 million. From a regional perspective, APAC held the largest market share, valued at USD 4,794.80 million. The rare earth metals market size is estimated to grow by USD 4,932.67 million from 2022 to 2027 at a CAGR of 8.3% according to Technavio.
Why Buy?
- Add credibility to strategy
- Analyzes competitor’s offerings
- Get a holistic view of the market
Grow your profit margin with Technavio – Buy the Report
Rare earth metals market – Customer Landscape
To help companies evaluate and develop growth strategies, the report outlines –
- Key purchase criteria
- Adoption rates
- Adoption lifecycle
- Drivers of price sensitivity
- For highlights on customer landscape analysis, download a sample!
Rare earth metals market – Vendor Insights
The growing competition in the market is compelling vendors to adopt various growth strategies such as promotional activities and spending on advertisements to improve the visibility of their services. Technavio report analyzes the market’s competitive landscape and offers information on several market vendors including –
- Alkane Resources Ltd – The company offers mining and exploration services for rare earth metals.
- Arafura Rare Earths Ltd. – The company offers mining extraction and separation plants for rare earth metals.
- Avalon Advanced Materials Inc. – The company offers a wide range of rare earth elements such as lithium, rare earth, cesium, tantalum, feldspars, tin, and indium.
- Canada Rare Earth Corp – The company offers mining and exploration for rare earth metals.
Rare earth metals market – Market Dynamics
Major Drivers –
- Growing demand for electronic appliances and personal equipment
- Surge in consumption from APAC
- Rise of new production capacities
KEY challenges –
- Demand-supply outages and the rise of substitutes
- Lack of skilled professionals in the mining sector
- Conservatism and federal control over production
The rare earth metals market report provides critical information and factual data, with a qualitative and quantitative study of the market based on market drivers and limitations as well as future prospects.
What are the key data covered in this rare earth metals market report?
- CAGR of the market during the forecast period
- Detailed information on factors that will drive the growth of the rare earth metals market between 2023 and 2027
- Precise estimation of the size of the rare earth metals market size and its contribution to the market in focus on the parent market
- Accurate predictions about upcoming trends and changes in consumer behavior
- Growth of the rare earth metals market industry across APAC, North America, Europe, Middle East and Africa, and South America
- A thorough analysis of the market’s competitive landscape and detailed information about vendors
- Comprehensive analysis of factors that will challenge the growth of rare earth metals market vendors
Gain instant access to 17,000+ market research reports.
Technavio’s SUBSCRIPTION platform
Related Reports:
- The Ti-6Al-4V Titanium Alloy Market is projected to grow by USD 707.41 million with a CAGR of 3.05% during the forecast period 2021 to 2026. The high demand for Ti-6Al-4V titanium alloy for orthopedic implants is one of the factors driving the Ti-6Al-4V titanium alloy market growth. The stringent certification process hindering the adoption of new technologies is one of the factors limiting the Ti-6Al-4V titanium alloy market’s growth.
- The Aluminum Scrap Recycling Market size is expected to increase by 12701.19 thousand tons from 2021 to 2026, and the market’s growth momentum will accelerate at a CAGR of 8.72%. The energy and environmental factors are notably driving the aluminum scrap recycling market growth, although factors such as a decrease in the recycling rate of used beverage cans may impede the market growth.
|
Rare Earth Metals Market Scope |
|
|
Report Coverage |
Details |
|
Page number |
171 |
|
Base year |
2022 |
|
Historic period |
2017-2021 |
|
Forecast period |
2023-2027 |
|
Growth momentum & CAGR |
Accelerate at a CAGR of 8.3% |
|
Market growth 2023-2027 |
USD 4932.67 million |
|
Market structure |
Fragmented |
|
YoY growth 2022-2023 (%) |
8.1 |
|
Regional analysis |
APAC, North America, Europe, Middle East and Africa, and South America |
|
Performing market contribution |
APAC at 72% |
|
Key countries |
US, China, Vietnam, Japan, and India |
|
Competitive landscape |
Leading Vendors, Market Positioning of Vendors, Competitive Strategies, and Industry Risks |
|
Key companies profiled |
Alkane Resources Ltd, Arafura Rare Earths Ltd., Arnold Magnetic Technologies Corp., Avalon Advanced Materials Inc., Canada Rare Earth Corp, Energy Transition Minerals Ltd., Frontier Rare Earths Ltd., HEFA Rare Earth Canada Co. Ltd., Hitachi Metals Ltd., Iluka Resources Ltd., IREL (India) Ltd., Lynas Rare Earths Ltd., MONTERO MINING AND EXPLORATION LTD., Namibia Critical Metals Inc, Neo Performance Materials Inc., Northern Minerals Ltd., Rare Element Resources Ltd., Shin Etsu Chemical Co. Ltd., SHOWA DENKO K.K., and Ucore Rare Metals Inc. |
|
Market dynamics |
Parent market analysis, market growth inducers and obstacles, fast-growing and slow-growing segment analysis, COVID-19 impact and recovery analysis and future consumer dynamics, and market condition analysis for the forecast period. |
|
Customization purview |
If our report has not included the data that you are looking for, you can reach out to our analysts and get segments customized. |
|
Customization purview |
If our report has not included the data that you are looking for, you can reach out to our analysts and get segments customized. |
Table of contents:
1 Executive Summary
- 1.1 Market overview
- Exhibit 01: Executive Summary – Chart on Market Overview
- Exhibit 02: Executive Summary – Data Table on Market Overview
- Exhibit 03: Executive Summary – Chart on Global Market Characteristics
- Exhibit 04: Executive Summary – Chart on Market by Geography
- Exhibit 05: Executive Summary – Chart on Market Segmentation by Application
- Exhibit 06: Executive Summary – Chart on Market Segmentation by Type
- Exhibit 07: Executive Summary – Chart on Incremental Growth
- Exhibit 08: Executive Summary – Data Table on Incremental Growth
- Exhibit 09: Executive Summary – Chart on Vendor Market Positioning
2 Market Landscape
- 2.1 Market ecosystem
- Exhibit 10: Parent market
- Exhibit 11: Market Characteristics
3 Market Sizing
- 3.1 Market definition
- Exhibit 12: Offerings of vendors included in the market definition
- 3.2 Market segment analysis
- Exhibit 13: Market segments
- 3.3 Market size 2022
- 3.4 Market outlook: Forecast for 2022-2027
- Exhibit 14: Chart on Global – Market size and forecast 2022-2027 ($ million)
- Exhibit 15: Data Table on Global – Market size and forecast 2022-2027 ($ million)
- Exhibit 16: Chart on Global Market: Year-over-year growth 2022-2027 (%)
- Exhibit 17: Data Table on Global Market: Year-over-year growth 2022-2027 (%)
4 Historic Market Size
- 4.1 Global rare earth metals market 2017 – 2021
- Exhibit 18: Historic Market Size – Data Table on Global rare earth metals market 2017 – 2021 ($ million)
- 4.2 Application Segment Analysis 2017 – 2021
- Exhibit 19: Historic Market Size – Application Segment 2017 – 2021 ($ million)
- 4.3 Type Segment Analysis 2017 – 2021
- Exhibit 20: Historic Market Size – Type Segment 2017 – 2021 ($ million)
- 4.4 Geography Segment Analysis 2017 – 2021
- Exhibit 21: Historic Market Size – Geography Segment 2017 – 2021 ($ million)
- 4.5 Country Segment Analysis 2017 – 2021
- Exhibit 22: Historic Market Size – Country Segment 2017 – 2021 ($ million)
5 Five Forces Analysis
- 5.1 Five forces summary
- Exhibit 23: Five forces analysis – Comparison between 2022 and 2027
- 5.2 Bargaining power of buyers
- Exhibit 24: Chart on Bargaining power of buyers – Impact of key factors 2022 and 2027
- 5.3 Bargaining power of suppliers
- Exhibit 25: Bargaining power of suppliers – Impact of key factors in 2022 and 2027
- 5.4 Threat of new entrants
- Exhibit 26: Threat of new entrants – Impact of key factors in 2022 and 2027
- 5.5 Threat of substitutes
- Exhibit 27: Threat of substitutes – Impact of key factors in 2022 and 2027
- 5.6 Threat of rivalry
- Exhibit 28: Threat of rivalry – Impact of key factors in 2022 and 2027
- 5.7 Market condition
- Exhibit 29: Chart on Market condition – Five forces 2022 and 2027
6 Market Segmentation by Application
- 6.1 Market segments
- Exhibit 30: Chart on Application – Market share 2022-2027 (%)
- Exhibit 31: Data Table on Application – Market share 2022-2027 (%)
- 6.2 Comparison by Application
- Exhibit 32: Chart on Comparison by Application
- Exhibit 33: Data Table on Comparison by Application
- 6.3 Permanent magnets – Market size and forecast 2022-2027
- Exhibit 34: Chart on Permanent magnets – Market size and forecast 2022-2027 ($ million)
- Exhibit 35: Data Table on Permanent magnets – Market size and forecast 2022-2027 ($ million)
- Exhibit 36: Chart on Permanent magnets – Year-over-year growth 2022-2027 (%)
- Exhibit 37: Data Table on Permanent magnets – Year-over-year growth 2022-2027 (%)
- 6.4 Metal alloys – Market size and forecast 2022-2027
- Exhibit 38: Chart on Metal alloys – Market size and forecast 2022-2027 ($ million)
- Exhibit 39: Data Table on Metal alloys – Market size and forecast 2022-2027 ($ million)
- Exhibit 40: Chart on Metal alloys – Year-over-year growth 2022-2027 (%)
- Exhibit 41: Data Table on Metal alloys – Year-over-year growth 2022-2027 (%)
- 6.5 Catalysts – Market size and forecast 2022-2027
- Exhibit 42: Chart on Catalysts – Market size and forecast 2022-2027 ($ million)
- Exhibit 43: Data Table on Catalysts – Market size and forecast 2022-2027 ($ million)
- Exhibit 44: Chart on Catalysts – Year-over-year growth 2022-2027 (%)
- Exhibit 45: Data Table on Catalysts – Year-over-year growth 2022-2027 (%)
- 6.6 Polishing powder – Market size and forecast 2022-2027
- Exhibit 46: Chart on Polishing powder – Market size and forecast 2022-2027 ($ million)
- Exhibit 47: Data Table on Polishing powder – Market size and forecast 2022-2027 ($ million)
- Exhibit 48: Chart on Polishing powder – Year-over-year growth 2022-2027 (%)
- Exhibit 49: Data Table on Polishing powder – Year-over-year growth 2022-2027 (%)
- 6.7 Others – Market size and forecast 2022-2027
- Exhibit 50: Chart on Others – Market size and forecast 2022-2027 ($ million)
- Exhibit 51: Data Table on Others – Market size and forecast 2022-2027 ($ million)
- Exhibit 52: Chart on Others – Year-over-year growth 2022-2027 (%)
- Exhibit 53: Data Table on Others – Year-over-year growth 2022-2027 (%)
- 6.8 Market opportunity by Application
- Exhibit 54: Market opportunity by Application ($ million)
7 Market Segmentation by Type
- 7.1 Market segments
- Exhibit 55: Chart on Type – Market share 2022-2027 (%)
- Exhibit 56: Data Table on Type – Market share 2022-2027 (%)
- 7.2 Comparison by Type
- Exhibit 57: Chart on Comparison by Type
- Exhibit 58: Data Table on Comparison by Type
- 7.3 Light rare earth elements – Market size and forecast 2022-2027
- Exhibit 59: Chart on Light rare earth elements – Market size and forecast 2022-2027 ($ million)
- Exhibit 60: Data Table on Light rare earth elements – Market size and forecast 2022-2027 ($ million)
- Exhibit 61: Chart on Light rare earth elements – Year-over-year growth 2022-2027 (%)
- Exhibit 62: Data Table on Light rare earth elements – Year-over-year growth 2022-2027 (%)
- 7.4 Heavy rare earth elements – Market size and forecast 2022-2027
- Exhibit 63: Chart on Heavy rare earth elements – Market size and forecast 2022-2027 ($ million)
- Exhibit 64: Data Table on Heavy rare earth elements – Market size and forecast 2022-2027 ($ million)
- Exhibit 65: Chart on Heavy rare earth elements – Year-over-year growth 2022-2027 (%)
- Exhibit 66: Data Table on Heavy rare earth elements – Year-over-year growth 2022-2027 (%)
- 7.5 Other element type – Market size and forecast 2022-2027
- Exhibit 67: Chart on Other element type – Market size and forecast 2022-2027 ($ million)
- Exhibit 68: Data Table on Other element type – Market size and forecast 2022-2027 ($ million)
- Exhibit 69: Chart on Other element type – Year-over-year growth 2022-2027 (%)
- Exhibit 70: Data Table on Other element type – Year-over-year growth 2022-2027 (%)
- 7.6 Market opportunity by Type
- Exhibit 71: Market opportunity by Type ($ million)
8 Customer Landscape
- 8.1 Customer landscape overview
- Exhibit 72: Analysis of price sensitivity, lifecycle, customer purchase basket, adoption rates, and purchase criteria
9 Geographic Landscape
- 9.1 Geographic segmentation
- Exhibit 73: Chart on Market share by geography 2022-2027 (%)
- Exhibit 74: Data Table on Market share by geography 2022-2027 (%)
- 9.2 Geographic comparison
- Exhibit 75: Chart on Geographic comparison
- Exhibit 76: Data Table on Geographic comparison
- 9.3 APAC – Market size and forecast 2022-2027
- Exhibit 77: Chart on APAC – Market size and forecast 2022-2027 ($ million)
- Exhibit 78: Data Table on APAC – Market size and forecast 2022-2027 ($ million)
- Exhibit 79: Chart on APAC – Year-over-year growth 2022-2027 (%)
- Exhibit 80: Data Table on APAC – Year-over-year growth 2022-2027 (%)
- 9.4 North America – Market size and forecast 2022-2027
- Exhibit 81: Chart on North America – Market size and forecast 2022-2027 ($ million)
- Exhibit 82: Data Table on North America – Market size and forecast 2022-2027 ($ million)
- Exhibit 83: Chart on North America – Year-over-year growth 2022-2027 (%)
- Exhibit 84: Data Table on North America – Year-over-year growth 2022-2027 (%)
- 9.5 Europe – Market size and forecast 2022-2027
- Exhibit 85: Chart on Europe – Market size and forecast 2022-2027 ($ million)
- Exhibit 86: Data Table on Europe – Market size and forecast 2022-2027 ($ million)
- Exhibit 87: Chart on Europe – Year-over-year growth 2022-2027 (%)
- Exhibit 88: Data Table on Europe – Year-over-year growth 2022-2027 (%)
- 9.6 Middle East and Africa – Market size and forecast 2022-2027
- Exhibit 89: Chart on Middle East and Africa – Market size and forecast 2022-2027 ($ million)
- Exhibit 90: Data Table on Middle East and Africa – Market size and forecast 2022-2027 ($ million)
- Exhibit 91: Chart on Middle East and Africa – Year-over-year growth 2022-2027 (%)
- Exhibit 92: Data Table on Middle East and Africa – Year-over-year growth 2022-2027 (%)
- 9.7 South America – Market size and forecast 2022-2027
- Exhibit 93: Chart on South America – Market size and forecast 2022-2027 ($ million)
- Exhibit 94: Data Table on South America – Market size and forecast 2022-2027 ($ million)
- Exhibit 95: Chart on South America – Year-over-year growth 2022-2027 (%)
- Exhibit 96: Data Table on South America – Year-over-year growth 2022-2027 (%)
- 9.8 China – Market size and forecast 2022-2027
- Exhibit 97: Chart on China – Market size and forecast 2022-2027 ($ million)
- Exhibit 98: Data Table on China – Market size and forecast 2022-2027 ($ million)
- Exhibit 99: Chart on China – Year-over-year growth 2022-2027 (%)
- Exhibit 100: Data Table on China – Year-over-year growth 2022-2027 (%)
- 9.9 Vietnam – Market size and forecast 2022-2027
- Exhibit 101: Chart on Vietnam – Market size and forecast 2022-2027 ($ million)
- Exhibit 102: Data Table on Vietnam – Market size and forecast 2022-2027 ($ million)
- Exhibit 103: Chart on Vietnam – Year-over-year growth 2022-2027 (%)
- Exhibit 104: Data Table on Vietnam – Year-over-year growth 2022-2027 (%)
- 9.10 US – Market size and forecast 2022-2027
- Exhibit 105: Chart on US – Market size and forecast 2022-2027 ($ million)
- Exhibit 106: Data Table on US – Market size and forecast 2022-2027 ($ million)
- Exhibit 107: Chart on US – Year-over-year growth 2022-2027 (%)
- Exhibit 108: Data Table on US – Year-over-year growth 2022-2027 (%)
- 9.11 Japan – Market size and forecast 2022-2027
- Exhibit 109: Chart on Japan – Market size and forecast 2022-2027 ($ million)
- Exhibit 110: Data Table on Japan – Market size and forecast 2022-2027 ($ million)
- Exhibit 111: Chart on Japan – Year-over-year growth 2022-2027 (%)
- Exhibit 112: Data Table on Japan – Year-over-year growth 2022-2027 (%)
- 9.12 India – Market size and forecast 2022-2027
- Exhibit 113: Chart on India – Market size and forecast 2022-2027 ($ million)
- Exhibit 114: Data Table on India – Market size and forecast 2022-2027 ($ million)
- Exhibit 115: Chart on India – Year-over-year growth 2022-2027 (%)
- Exhibit 116: Data Table on India – Year-over-year growth 2022-2027 (%)
- 9.13 Market opportunity by geography
- Exhibit 117: Market opportunity by geography ($ million)
10 Drivers, Challenges, and Trends
- 10.1 Market drivers
- 10.2 Market challenges
- 10.3 Impact of drivers and challenges
- Exhibit 118: Impact of drivers and challenges in 2022 and 2027
- 10.4 Market trends
11 Vendor Landscape
- 11.1 Overview
- 11.2 Vendor landscape
- Exhibit 119: Overview on Criticality of inputs and Factors of differentiation
- 11.3 Landscape disruption
- Exhibit 120: Overview on factors of disruption
- 11.4 Industry risks
- Exhibit 121: Impact of key risks on business
12 Vendor Analysis
- 12.1 Vendors covered
- Exhibit 122: Vendors covered
- 12.2 Market positioning of vendors
- Exhibit 123: Matrix on vendor position and classification
- 12.3 Alkane Resources Ltd
- Exhibit 124: Alkane Resources Ltd – Overview
- Exhibit 125: Alkane Resources Ltd – Product / Service
- Exhibit 126: Alkane Resources Ltd – Key offerings
- 12.4 Arafura Rare Earths Ltd.
- Exhibit 127: Arafura Rare Earths Ltd. – Overview
- Exhibit 128: Arafura Rare Earths Ltd. – Product / Service
- Exhibit 129: Arafura Rare Earths Ltd. – Key offerings
- 12.5 Avalon Advanced Materials Inc.
- Exhibit 130: Avalon Advanced Materials Inc. – Overview
- Exhibit 131: Avalon Advanced Materials Inc. – Product / Service
- Exhibit 132: Avalon Advanced Materials Inc. – Key offerings
- 12.6 Canada Rare Earth Corp
- Exhibit 133: Canada Rare Earth Corp – Overview
- Exhibit 134: Canada Rare Earth Corp – Product / Service
- Exhibit 135: Canada Rare Earth Corp – Key offerings
- 12.7 Energy Transition Minerals Ltd.
- Exhibit 136: Energy Transition Minerals Ltd. – Overview
- Exhibit 137: Energy Transition Minerals Ltd. – Product / Service
- Exhibit 138: Energy Transition Minerals Ltd. – Key offerings
- 12.8 Frontier Rare Earths Ltd.
- Exhibit 139: Frontier Rare Earths Ltd. – Overview
- Exhibit 140: Frontier Rare Earths Ltd. – Product / Service
- Exhibit 141: Frontier Rare Earths Ltd. – Key offerings
- 12.9 HEFA Rare Earth Canada Co. Ltd.
- Exhibit 142: HEFA Rare Earth Canada Co. Ltd. – Overview
- Exhibit 143: HEFA Rare Earth Canada Co. Ltd. – Product / Service
- Exhibit 144: HEFA Rare Earth Canada Co. Ltd. – Key offerings
- 12.10 Hitachi Metals Ltd.
- Exhibit 145: Hitachi Metals Ltd. – Overview
- Exhibit 146: Hitachi Metals Ltd. – Business segments
- Exhibit 147: Hitachi Metals Ltd. – Key offerings
- Exhibit 148: Hitachi Metals Ltd. – Segment focus
- 12.11 Iluka Resources Ltd.
- Exhibit 149: Iluka Resources Ltd. – Overview
- Exhibit 150: Iluka Resources Ltd. – Business segments
- Exhibit 151: Iluka Resources Ltd. – Key offerings
- Exhibit 152: Iluka Resources Ltd. – Segment focus
- 12.12 IREL (India) Ltd.
- Exhibit 153: IREL (India) Ltd. – Overview
- Exhibit 154: IREL (India) Ltd. – Product / Service
- Exhibit 155: IREL (India) Ltd. – Key offerings
- 12.13 Lynas Rare Earths Ltd.
- Exhibit 156: Lynas Rare Earths Ltd. – Overview
- Exhibit 157: Lynas Rare Earths Ltd. – Product / Service
- Exhibit 158: Lynas Rare Earths Ltd. – Key offerings
- 12.14 Neo Performance Materials Inc.
- Exhibit 159: Neo Performance Materials Inc. – Overview
- Exhibit 160: Neo Performance Materials Inc. – Business segments
- Exhibit 161: Neo Performance Materials Inc. – Key offerings
- Exhibit 162: Neo Performance Materials Inc. – Segment focus
- 12.15 Northern Minerals Ltd.
- Exhibit 163: Northern Minerals Ltd. – Overview
- Exhibit 164: Northern Minerals Ltd. – Product / Service
- Exhibit 165: Northern Minerals Ltd. – Key offerings
- 12.16 Shin Etsu Chemical Co. Ltd.
- Exhibit 166: Shin Etsu Chemical Co. Ltd. – Overview
- Exhibit 167: Shin Etsu Chemical Co. Ltd. – Business segments
- Exhibit 168: Shin Etsu Chemical Co. Ltd. – Key offerings
- Exhibit 169: Shin Etsu Chemical Co. Ltd. – Segment focus
- 12.17 SHOWA DENKO K.K.
- Exhibit 170: SHOWA DENKO K.K. – Overview
- Exhibit 171: SHOWA DENKO K.K. – Business segments
- Exhibit 172: SHOWA DENKO K.K. – Key news
- Exhibit 173: SHOWA DENKO K.K. – Key offerings
- Exhibit 174: SHOWA DENKO K.K. – Segment focus
13 Appendix
- 13.1 Scope of the report
- 13.2 Inclusions and exclusions checklist
- Exhibit 175: Inclusions checklist
- Exhibit 176: Exclusions checklist
- 13.3 Currency conversion rates for US$
- Exhibit 177: Currency conversion rates for US$
- 13.4 Research methodology
- Exhibit 178: Research methodology
- Exhibit 179: Validation techniques employed for market sizing
- Exhibit 180: Information sources
- 13.5 List of abbreviations
- Exhibit 181: List of abbreviations
About Us
Technavio is a leading global technology research and advisory company. Their research and analysis focuses on emerging market trends and provides actionable insights to help businesses identify market opportunities and develop effective strategies to optimize their market positions. With over 500 specialized analysts, Technavio’s report library consists of more than 17,000 reports and counting, covering 800 technologies, spanning across 50 countries. Their client base consists of enterprises of all sizes, including more than 100 Fortune 500 companies. This growing client base relies on Technavio’s comprehensive coverage, extensive research, and actionable market insights to identify opportunities in existing and potential markets and assess their competitive positions within changing market scenarios.
Contact
Technavio Research
Jesse Maida
Media & Marketing Executive
US: +1 844 364 1100
UK: +44 203 893 3200
Email: [email protected]
Website: www.technavio.com/

View original content to download multimedia:https://www.prnewswire.com/news-releases/rare-earth-metals-market-to-grow-by-8-1-y-o-y-in-2023-growing-demand-for-electronic-appliances-and-personal-equipment-will-drive-growth—technavio-301715288.html
SOURCE Technavio
tsx-avl avalon-advanced-materials-inc avalon advanced materials inc tsxv-mon montero-mining-and-exploration-ltd montero mining and exploration ltd tsxv-ucu ucore-rare-metals-inc ucore rare metals inc press-release


Dolly Varden consolidates Big Bulk copper-gold porphyry by acquiring southern-portion claims – Richard Mills
2023.12.22
Dolly Varden Silver’s (TSXV:DV, OTCQX:DOLLF) stock price shot up 16 cents for a gain of 20% Thursday, after announcing a consolidation of…

GoldTalks: Going big on ASX-listed gold stocks
Aussie investors are spoiled for choice when it comes to listed goldies, says Kyle Rodda. Here are 3 blue chips … Read More
The post GoldTalks: Going…
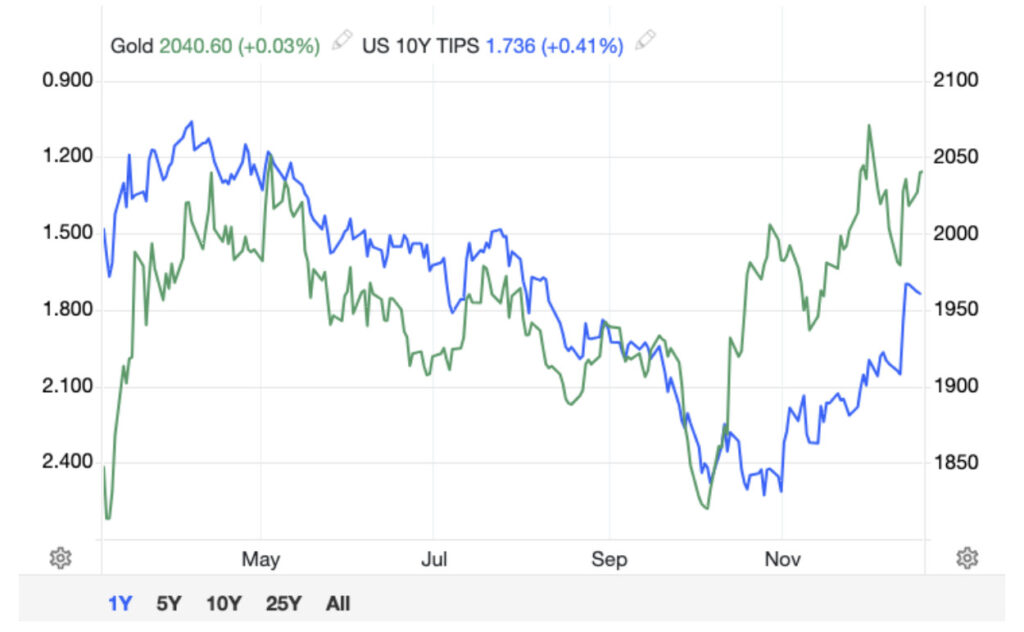
Gold Digger: ‘Assured growth’ – central bank buying spree set to drive gold higher in 2024
Central banks will drive the price of gold higher in 2024, believe various analysts Spot gold prices seem stable to … Read More
The post Gold Digger:…