Companies
The Last Time Interest in Gold and Silver was this High, the Global Economy was Collapsing
The Perth Mint sold 80,541oz of gold and 1,823,096oz of silver in minted product form during March 2023 – a … Read More
The post Gold Digger: The last…

- Aussie Google searches for ‘how to buy and gold and silver’ at 12 year highs
- Reporting season:
- Wednesday small cap standouts: GBM Resources, Ora Banda Mining
Our Gold Digger column wraps all the news driving ASX stocks with exposure to precious metals.
The Wall Street Journal says searches for ‘How to Buy Gold’ just hit a Google record.
So, we did our own search. In Australia, Google Trends tells us that searches for ‘How to Buy Gold’ are now at their highest point since May 2011, when the world was bloodied and bruised by after-effects of the Global Economic Crisis.
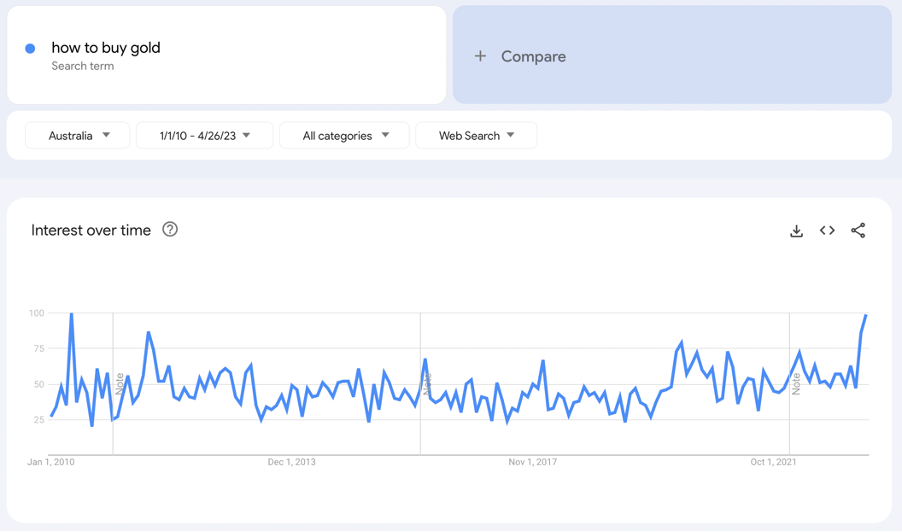
At the time gold was mid bull run, paying ~US$1400/oz ahead of a peak of ~US$1900/oz in August.
The graph data is normalised from 0 to 100, so it shows relative interest over time.
Meanwhile, Aussie searches for ‘How to Buy Silver’ are nearing their highest point since February 2010. History tells us the silver price would then go parabolic, peaking at a remarkable US$50/oz in April 2011 due to concerns about inflation and government indebtedness. Sound familiar?
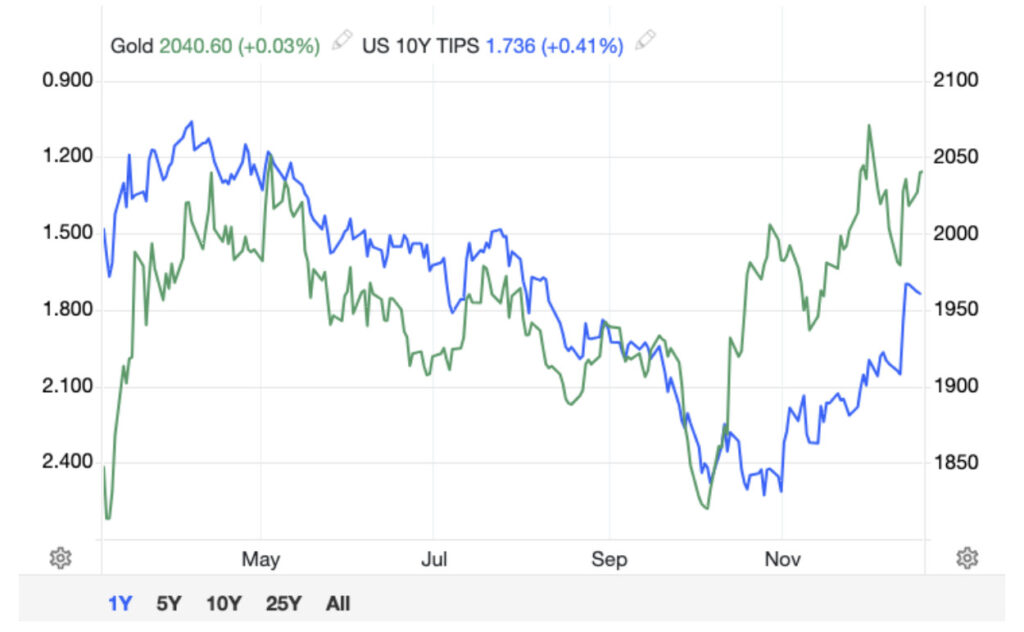
Right now, Aussie gold and silver prices are paying a lofty $3018/oz and $37.82/oz.
Retail demand for gold and silver is flying
Late last year we asked bullion trader Perth Mint this exact question.
Retail investment in gold bar and coins has been supercharged for the last few years, despite the precious metal’s unpredictable pricing action over that time.
Perth Mint General Manager of Minted Products Neil Vance said the run-on gold and silver started around April 2020.
“Really since that time has seen no let up, and it has continued into 2022,” he said last June.
“We have seen it all around the world, but our two largest export markets for our physical coins are the US and Germany.
“Here, it has been an incredible surge in demand.”
It’s the same in Australia, he said.
“I’ve been here [at Perth Mint] for 19 years and have never seen the Australian market like this and the demand we have experienced,” Vance says.
The Perth Mint sold 80,541oz of gold and 1,823,096oz of silver in minted product form during March 2023 – a big 54% jump on February.
There’s still room for growth, with gold sales down 34% compared to March 2022.
How to buy gold and silver
It is quite easy to purchase precious metals, says Vance, but his key message to buyers is this: do your research, and buy from trusted distributors.

How did ASX gold miners perform on Wednesday?
It’s reporting season, and our gold miners are generally putting up solid numbers.
Unhedged producer Gold Road Resources (ASX:GOR) put on another 5% in early trade after a good set of results announced Monday.
And then there are today’s results — Westgold (ASX:WGX) has been a classic rebound play this year.
A 2023 pick for a number of gold bull mining analysts, including Argonaut head of fund management David Franklyn, Westgold is up a handy 66.11% YTD and having gone from Monster to Mouse in 2022 is back in Monster territory in 2023 at a market cap of over $700 million.
The numbers from March make for decent if not spectacular reading. Cash was up $9m to $168m with positive mine operating cashflow of $32m as 60,512oz left its network of gold mines in WA’s Mid West at all in sustaining costs of $2094/oz.
With 188,740oz produced this financial year so far, WGX is tracking towards the top end of its guidance of 240,000-260,000oz and said today it plans to hit the mid-point of its $1900-2100/oz cost guidance with costs through the first nine months of $2077/oz.
West African Resources (ASX:WAF) saw production lift 13% QoQ to 56,307oz in the March term, with costs down 10% to US$1172/oz.
That came against 48,208oz of unhedged gold sales at an average price of US$1878/oz, generating $29m of operating cashflow after a $25m 2021 income tax payment.
WAF expects to deliver 210,000-230,000oz at AISC of US$1175/oz this calendar year, while pushing ahead with the construction of its Kiaka gold mine, where it spent $39m on early capex in March.
Production is expected to average more than 200,000ozpa in 2023 and 2024 before lifting to more than 400,000ozpa from 2025 once the Kiaka mine is online to complement its Sanbrado operation in Burkina Faso.
Winners & Losers
Here’s how ASX-listed precious metals stocks are performing:
Scroll or swipe to reveal table. Click headings to sort. Best viewed on a laptop.
Stocks missing from this list? Email [email protected]
| Code | Company | % Wednesday | % Week | % Month | % YTD | % Year | Price | Market Cap |
|---|---|---|---|---|---|---|---|---|
| MCT | Metalicity Limited | 50% | 20% | 50% | 0% | -61% | 0.003 | $7,009,079 |
| A1G | African Gold . | 17% | 7% | 16% | -2% | -44% | 0.081 | $11,682,474 |
| RMX | Red Mount Min | 17% | 17% | -13% | -30% | -63% | 0.0035 | $6,815,553 |
| GBZ | GBM Rsources | 14% | 10% | 22% | -23% | -74% | 0.033 | $16,331,657 |
| ICG | Inca Minerals | 13% | -6% | -15% | -26% | -82% | 0.017 | $7,252,717 |
| WCN | White Cliff Min | 13% | 13% | 0% | -36% | -69% | 0.009 | $7,672,435 |
| AVM | Advance Metals | 13% | 0% | 13% | -10% | -47% | 0.009 | $4,656,353 |
| OKR | Okapi Resources | 12% | 12% | 4% | -7% | -61% | 0.14 | $22,948,227 |
| OBM | Ora Banda Mining | 10% | 14% | 23% | 90% | 227% | 0.16 | $233,615,332 |
| GAL | Galileo Mining | 10% | 9% | 20% | -13% | 212% | 0.765 | $137,349,324 |
| LCL | Los Cerros Limited | 10% | 13% | -3% | -40% | -65% | 0.034 | $24,623,438 |
| XAM | Xanadu Mines | 9% | -2% | 31% | 62% | 31% | 0.047 | $70,426,440 |
| MOH | Moho Resources | 9% | 20% | 26% | 14% | -63% | 0.024 | $4,568,568 |
| VKA | Viking Mines | 9% | 0% | 0% | 20% | 0% | 0.012 | $11,277,843 |
| ADG | Adelong Gold Limited | 9% | -20% | 0% | 71% | -60% | 0.012 | $5,872,045 |
| TSO | Tesoro Gold | 8% | 39% | 34% | 8% | -49% | 0.039 | $37,926,453 |
| CXU | Cauldron Energy | 8% | 8% | -19% | -7% | -61% | 0.0065 | $5,589,412 |
| LRL | Labyrinth Resources | 8% | -10% | 8% | -24% | -73% | 0.013 | $11,513,848 |
| KIN | KIN Min NL | 8% | 0% | -7% | -37% | -56% | 0.041 | $44,769,721 |
| BEZ | Besragoldinc | 7% | 9% | 50% | 362% | 313% | 0.24 | $79,618,925 |
| POL | Polymetals Resources | 6% | 30% | 92% | 41% | 200% | 0.345 | $14,684,375 |
| ALK | Alkane Resources | 6% | 5% | 21% | 68% | -21% | 0.9 | $508,973,703 |
| TAM | Tanami Gold NL | 6% | 3% | 6% | -5% | -40% | 0.037 | $41,128,397 |
| RXL | Rox Resources | 6% | -4% | 28% | 111% | -10% | 0.37 | $78,523,991 |
| GSR | Greenstone Resources | 6% | -5% | -10% | -41% | -46% | 0.019 | $21,838,831 |
| PNM | Pacific Nickel Mines | 5% | 5% | 35% | 20% | -5% | 0.1 | $36,100,403 |
| AZY | Antipa Minerals | 5% | 0% | 5% | -5% | -55% | 0.02 | $68,267,777 |
| MKR | Manuka Resources. | 5% | 1% | 9% | -4% | -73% | 0.082 | $42,187,865 |
| MAU | Magnetic Resources | 5% | -11% | -24% | -40% | -64% | 0.52 | $113,608,629 |
| MEI | Meteoric Resources | 5% | 31% | 21% | 197% | 826% | 0.1575 | $260,781,313 |
| TAR | Taruga Minerals | 5% | 14% | 50% | -13% | 0% | 0.021 | $14,120,536 |
| GOR | Gold Road Res | 5% | 5% | 17% | 11% | 15% | 1.8825 | $1,935,766,397 |
| SNG | Siren Gold | 5% | -4% | 16% | -40% | -73% | 0.11 | $14,097,175 |
| PGO | Pacgold | 5% | -2% | 19% | 22% | -41% | 0.44 | $23,083,962 |
| KSN | Kingston Resources | 5% | 0% | 25% | 42% | -36% | 0.115 | $45,721,902 |
| BGD | Bartongoldholdings | 4% | 7% | 14% | 20% | -2% | 0.24 | $19,856,612 |
| MEG | Megado Minerals | 4% | 0% | 35% | 11% | -72% | 0.05 | $6,866,667 |
| EVN | Evolution Mining | 4% | 1% | 21% | 20% | -14% | 3.58 | $6,312,456,137 |
| FG1 | Flynngold | 4% | -14% | -4% | -23% | -48% | 0.077 | $7,612,642 |
| AGG | AngloGold Ashanti | 4% | 2% | 26% | 36% | 34% | 8.01 | $686,899,791 |
| S2R | S2 Resources | 4% | -4% | 0% | -21% | -13% | 0.135 | $53,311,898 |
| WGX | Westgold Resources. | 4% | 2% | 26% | 71% | -15% | 1.4925 | $682,016,731 |
| FEG | Far East Gold | 3% | -5% | -6% | -38% | -9% | 0.3 | $44,383,981 |
| KRM | Kingsrose Mining | 3% | 0% | 9% | -3% | -21% | 0.063 | $45,904,118 |
| AME | Alto Metals Limited | 3% | 2% | -3% | -1% | -28% | 0.066 | $39,220,191 |
| WAF | West African Res | 3% | 0% | 4% | -14% | -24% | 1.01 | $1,003,106,192 |
| SBM | St Barbara Limited | 3% | 9% | -8% | -24% | -59% | 0.5925 | $469,511,446 |
| AM7 | Arcadia Minerals | 3% | 6% | -18% | -12% | -42% | 0.18 | $8,172,131 |
| SLR | Silver Lake Resource | 3% | 1% | 11% | 6% | -41% | 1.2575 | $1,138,936,808 |
| VMC | Venus Metals Cor | 3% | 3% | 29% | 48% | 0% | 0.2 | $34,725,343 |
| AQI | Alicanto Min | 3% | -5% | 14% | -7% | -60% | 0.04 | $20,912,331 |
| BGL | Bellevue Gold | 2% | 2% | 16% | 25% | 40% | 1.4175 | $1,565,105,025 |
| IDA | Indiana Resources | 2% | -9% | 2% | -13% | -25% | 0.048 | $23,674,126 |
| GML | Gateway Mining | 2% | -6% | 11% | -18% | -59% | 0.049 | $12,784,010 |
| NST | Northern Star | 2% | -1% | 20% | 27% | 29% | 13.86 | $15,627,758,801 |
| HAV | Havilah Resources | 2% | -10% | -14% | -15% | 51% | 0.28 | $87,075,783 |
| CMM | Capricorn Metals | 2% | -4% | -1% | -1% | 2% | 4.535 | $1,675,881,461 |
| NCM | Newcrest Mining | 2% | 0% | 11% | 41% | 3% | 29.1 | $25,601,825,857 |
| TBR | Tribune Res | 2% | -3% | 6% | -2% | -19% | 3.93 | $203,051,458 |
| RND | Rand Mining | 2% | 2% | -3% | -1% | -15% | 1.35 | $75,645,028 |
| MZZ | Matador Mining | 1% | 0% | -14% | -38% | -74% | 0.071 | $22,065,318 |
| PGD | Peregrine Gold | 1% | -4% | -12% | -8% | -30% | 0.355 | $19,628,627 |
| RRL | Regis Resources | 1% | 0% | 16% | 5% | 0% | 2.16 | $1,608,205,220 |
| MLS | Metals Australia | 1% | -1% | -1% | -18% | -77% | 0.0365 | $21,853,303 |
| ADT | Adriatic Metals | 1% | 0% | -4% | 17% | 44% | 3.68 | $807,138,573 |
| BNZ | Benzmining | 1% | -5% | 1% | -7% | -46% | 0.38 | $27,395,550 |
| FML | Focus Minerals | 1% | 5% | 18% | -24% | -19% | 0.195 | $55,162,539 |
| DEG | De Grey Mining | 1% | 5% | 10% | 30% | 28% | 1.665 | $2,568,119,575 |
| BC8 | Black Cat Syndicate | 1% | -1% | 20% | 27% | -22% | 0.45 | $118,621,182 |
| SVL | Silver Mines Limited | 1% | -7% | 34% | 14% | -1% | 0.2275 | $315,974,732 |
| BRB | Breaker Res NL | 1% | -5% | 21% | 47% | 68% | 0.47 | $153,640,110 |
| KCN | Kingsgate Consolid. | 1% | -6% | -28% | -16% | -12% | 1.455 | $362,906,669 |
| SSR | SSR Mining Inc. | 1% | -4% | 5% | -3% | -29% | 22.34 | $406,292,551 |
| RMS | Ramelius Resources | 1% | -5% | 16% | 44% | -11% | 1.3375 | $1,161,420,732 |
| SFR | Sandfire Resources | 0% | -6% | 12% | 21% | 23% | 6.56 | $2,983,504,290 |
| PRU | Perseus Mining | 0% | -3% | -2% | 9% | 19% | 2.295 | $3,132,444,215 |
| MRR | Minrex Resources | 0% | -6% | -27% | -50% | -77% | 0.016 | $17,357,880 |
| NPM | Newpeak Metals | 0% | 0% | 0% | 0% | 0% | 0.001 | $9,145,132 |
| FFX | Firefinch | 0% | 0% | 0% | 0% | -47% | 0.2 | $236,569,315 |
| GED | Golden Deeps | 0% | -6% | -6% | -17% | -61% | 0.0075 | $8,664,200 |
| G88 | Golden Mile Res | 0% | -5% | 31% | 3% | -68% | 0.021 | $5,532,077 |
| DCX | Discovex Res | 0% | 0% | 0% | 0% | -61% | 0.003 | $9,907,704 |
| NMR | Native Mineral Res | 0% | 0% | -29% | -64% | -80% | 0.04 | $4,805,549 |
| AQX | Alice Queen | 0% | 0% | 50% | -25% | -81% | 0.0015 | $3,795,431 |
| MKG | Mako Gold | 0% | -5% | -10% | -5% | -60% | 0.038 | $17,922,752 |
| PNX | PNX Metals Limited | 0% | 0% | 20% | -29% | -47% | 0.003 | $16,141,874 |
| GIB | Gibb River Diamonds | 0% | 7% | -4% | -18% | -26% | 0.049 | $10,363,963 |
| BNR | Bulletin Res | 0% | -2% | -1% | -5% | -63% | 0.088 | $25,836,017 |
| SKY | SKY Metals | 0% | -5% | 16% | 19% | -46% | 0.057 | $21,476,658 |
| LM8 | Lunnonmetalslimited | 0% | 2% | 8% | 30% | 1% | 1.16 | $127,470,329 |
| CST | Castile Resources | 0% | -9% | -4% | -4% | -46% | 0.091 | $22,013,121 |
| YRL | Yandal Resources | 0% | -6% | -3% | -11% | -65% | 0.087 | $13,728,868 |
| FAU | First Au | 0% | -14% | 20% | 50% | -57% | 0.006 | $6,568,700 |
| GWR | GWR Group | 0% | 7% | -15% | 37% | -51% | 0.081 | $26,018,549 |
| GTR | Gti Energy | 0% | 6% | 0% | -17% | -58% | 0.009 | $16,132,352 |
| IPT | Impact Minerals | 0% | 8% | 30% | 86% | -11% | 0.013 | $32,257,817 |
| PUA | Peak Minerals | 0% | -20% | 0% | -33% | -76% | 0.004 | $4,165,506 |
| SMS | Starmineralslimited | 0% | 0% | -1% | 1% | -64% | 0.073 | $2,200,351 |
| MVL | Marvel Gold Limited | 0% | -12% | -12% | -42% | -67% | 0.015 | $10,576,416 |
| PRX | Prodigy Gold NL | 0% | 0% | 10% | -8% | -46% | 0.011 | $19,226,711 |
| CWX | Carawine Resources | 0% | 2% | -1% | -3% | -52% | 0.097 | $19,091,294 |
| CAZ | Cazaly Resources | 0% | 0% | 4% | -18% | -26% | 0.028 | $10,411,010 |
| BMR | Ballymore Resources | 0% | -6% | 0% | 0% | -18% | 0.15 | $14,447,618 |
| REZ | Resourc & En Grp | 0% | 0% | 8% | -13% | -70% | 0.014 | $6,997,281 |
| GMR | Golden Rim Resources | 0% | 3% | 6% | 10% | -53% | 0.034 | $20,114,005 |
| KAL | Kalgoorliegoldmining | 0% | -7% | -27% | -52% | -72% | 0.04 | $3,100,841 |
| ADN | Andromeda Metals | 0% | -2% | -2% | -5% | -58% | 0.042 | $130,620,354 |
| WA8 | Warriedarresour | 0% | 0% | -7% | -24% | 0% | 0.13 | $56,037,646 |
| WRM | White Rock Min | 0% | 0% | 0% | -5% | -70% | 0.063 | $17,508,200 |
| CTO | Citigold Corp | 0% | -17% | 0% | -17% | -38% | 0.005 | $14,368,295 |
| MHC | Manhattan Corp | 0% | 0% | -9% | -9% | -64% | 0.005 | $14,681,393 |
| TRY | Troy Resources | 0% | 0% | 0% | 0% | 0% | 0.0295 | $62,920,961 |
| CGN | Crater Gold Min | 0% | 0% | 0% | 0% | 0% | 0.014499 | $17,965,037 |
| SVG | Savannah Goldfields | 0% | 0% | -1% | -13% | -18% | 0.165 | $31,159,992 |
| GUL | Gullewa Limited | 0% | -2% | -2% | -8% | -32% | 0.055 | $10,767,521 |
| ADV | Ardiden | 0% | 0% | 0% | 0% | -52% | 0.007 | $18,818,347 |
| AAR | Astral Resources NL | 0% | -4% | 0% | 13% | -13% | 0.081 | $53,898,208 |
| NAE | New Age Exploration | 0% | 0% | -17% | -29% | -64% | 0.005 | $7,179,495 |
| XTC | Xantippe Res | 0% | 0% | 0% | -20% | -71% | 0.004 | $42,320,399 |
| TTM | Titan Minerals | 0% | 5% | 5% | -4% | -36% | 0.064 | $90,321,484 |
| NML | Navarre Minerals | 0% | 0% | 3% | -27% | -68% | 0.03 | $45,086,374 |
| BCN | Beacon Minerals | 0% | -9% | 14% | 14% | -11% | 0.032 | $120,216,581 |
| EM2 | Eagle Mountain | 0% | -19% | -31% | -26% | -70% | 0.125 | $38,120,858 |
| MEU | Marmota Limited | 0% | -5% | -8% | -25% | -25% | 0.036 | $38,116,821 |
| NVA | Nova Minerals | 0% | -1% | -20% | -47% | -53% | 0.36 | $75,920,319 |
| DCN | Dacian Gold | 0% | 1% | 8% | -16% | -69% | 0.084 | $102,211,279 |
| ICL | Iceni Gold | 0% | -2% | -24% | -21% | -58% | 0.063 | $13,140,000 |
| RML | Resolution Minerals | 0% | 0% | -17% | -38% | -69% | 0.005 | $5,398,731 |
| AL8 | Alderan Resource | 0% | 14% | 0% | 14% | -69% | 0.008 | $4,859,271 |
| GMN | Gold Mountain | 0% | 0% | -25% | -57% | -63% | 0.003 | $5,909,798 |
| TBA | Tombola Gold | 0% | 0% | 0% | 0% | -55% | 0.026 | $33,129,243 |
| HRN | Horizon Gold | 0% | 0% | 6% | 19% | -13% | 0.37 | $46,317,207 |
| QML | Qmines Limited | 0% | -6% | -12% | -9% | -46% | 0.15 | $13,531,355 |
| RDN | Raiden Resources | 0% | 0% | -16% | -16% | -68% | 0.004 | $7,418,330 |
| DTM | Dart Mining NL | 0% | -17% | 36% | 9% | -21% | 0.06 | $9,337,234 |
| EMU | EMU NL | 0% | 0% | 0% | -59% | -86% | 0.002 | $2,900,043 |
| SFM | Santa Fe Minerals | 0% | -8% | -5% | -31% | -54% | 0.055 | $4,005,033 |
| X64 | Ten Sixty Four | 0% | 0% | 0% | -11% | -34% | 0.57 | $130,184,182 |
| SI6 | SI6 Metals Limited | 0% | 0% | 0% | -17% | -50% | 0.005 | $7,476,973 |
| HAW | Hawthorn Resources | 0% | 18% | 2% | -26% | -45% | 0.085 | $28,476,327 |
| SVY | Stavely Minerals | 0% | 3% | -14% | -37% | -60% | 0.155 | $50,572,426 |
| KWR | Kingwest Resources | 0% | -3% | 0% | -11% | -82% | 0.031 | $8,733,531 |
| AGC | AGC | 0% | 4% | -5% | -13% | -46% | 0.052 | $5,200,000 |
| RVR | Red River Resources | 0% | 0% | 0% | 0% | -70% | 0.073 | $37,847,908 |
| RGL | Riversgold | 0% | 7% | 0% | -47% | -78% | 0.016 | $15,127,483 |
| MM8 | Medallion Metals. | 0% | -16% | -19% | -32% | -62% | 0.105 | $24,216,414 |
| AUT | Auteco Minerals | 0% | -15% | -2% | -22% | -47% | 0.04 | $92,513,452 |
| CBY | Canterbury Resources | 0% | 0% | -8% | -10% | -38% | 0.037 | $5,347,371 |
| LYN | Lycaonresources | 0% | -11% | -6% | -42% | -63% | 0.16 | $5,267,000 |
| TMZ | Thomson Res | 0% | 0% | 0% | -74% | -88% | 0.005 | $4,349,755 |
| WMC | Wiluna Mining Corp | 0% | 0% | 0% | 0% | -73% | 0.205 | $74,238,031 |
| NWM | Norwest Minerals | 0% | 0% | 28% | -31% | -33% | 0.037 | $9,152,735 |
| BMO | Bastion Minerals | 0% | 0% | -18% | -32% | -88% | 0.023 | $3,666,466 |
| GSM | Golden State Mining | 0% | -6% | 0% | -26% | -62% | 0.032 | $3,744,455 |
| GSN | Great Southern | 0% | -9% | 0% | -31% | -67% | 0.02 | $13,270,140 |
| RED | Red 5 Limited | 0% | -8% | 18% | -20% | -61% | 0.165 | $570,814,758 |
| THR | Thor Energy PLC | 0% | 11% | 25% | -17% | -69% | 0.005 | $7,380,564 |
| BAT | Battery Minerals | 0% | -13% | 0% | -13% | -61% | 0.0035 | $11,749,298 |
| RDS | Redstone Resources | 0% | 0% | 0% | 25% | -13% | 0.01 | $7,368,324 |
| GBR | Greatbould Resources | 0% | -10% | 2% | -2% | -28% | 0.089 | $43,168,701 |
| KAI | Kairos Minerals | 0% | 10% | 10% | -4% | -27% | 0.022 | $43,210,057 |
| HRZ | Horizon | 0% | -5% | 28% | -3% | -51% | 0.059 | $41,122,037 |
| CAI | Calidus Resources | 0% | -23% | -13% | -24% | -80% | 0.205 | $90,107,922 |
| CDT | Castle Minerals | 0% | 7% | -11% | -24% | -70% | 0.016 | $17,991,888 |
| RSG | Resolute Mining | 0% | -6% | 14% | 120% | 40% | 0.44 | $936,762,890 |
| ALY | Alchemy Resource | 0% | 0% | 0% | -39% | -48% | 0.014 | $16,493,068 |
| HXG | Hexagon Energy | 0% | -8% | -8% | -35% | -75% | 0.011 | $5,642,075 |
| AVW | Avira Resources | 0% | 0% | 0% | 0% | -54% | 0.003 | $6,401,370 |
| MAT | Matsa Resources | 0% | 0% | 16% | 16% | -39% | 0.043 | $17,716,199 |
| ZAG | Zuleika Gold | 0% | -13% | 8% | -33% | -56% | 0.014 | $7,322,709 |
| SBR | Sabre Resources | 0% | 5% | -18% | -39% | -62% | 0.023 | $6,704,182 |
| CHZ | Chesser Resources | 0% | -5% | -13% | -9% | -33% | 0.077 | $45,322,304 |
| KTA | Krakatoa Resources | 0% | 0% | 14% | -25% | -75% | 0.033 | $11,375,427 |
| ARN | Aldoro Resources | 0% | -8% | -18% | 3% | -45% | 0.165 | $22,179,918 |
| MBK | Metal Bank | 0% | 3% | 10% | -6% | -54% | 0.032 | $8,847,537 |
| A8G | Australasian Metals | 0% | -3% | -9% | -18% | -69% | 0.155 | $6,381,427 |
| TLM | Talisman Mining | 0% | 0% | 0% | 0% | -20% | 0.14 | $26,283,530 |
| PKO | Peako Limited | 0% | 13% | -10% | -38% | -55% | 0.009 | $4,236,583 |
| OAU | Ora Gold Limited | 0% | 20% | 20% | -40% | -70% | 0.003 | $11,810,775 |
| GNM | Great Northern | 0% | 0% | -14% | -25% | -50% | 0.003 | $5,127,153 |
| DEX | Duke Exploration | 0% | 0% | 0% | 0% | -66% | 0.053 | $5,587,240 |
| MOM | Moab Minerals | 0% | 0% | 0% | -22% | -75% | 0.007 | $4,773,744 |
| KNB | Koonenberrygold | 0% | -2% | 4% | -11% | -45% | 0.055 | $4,166,604 |
| AWJ | Auric Mining | 0% | 4% | 17% | -19% | -40% | 0.052 | $6,804,699 |
| ENR | Encounter Resources | 0% | 0% | 21% | -19% | -9% | 0.145 | $51,551,238 |
| AYM | Australia United Min | 0% | 0% | 0% | 0% | -50% | 0.003 | $5,527,732 |
| ANL | Amani Gold | 0% | 0% | 0% | 0% | -50% | 0.001 | $25,143,441 |
| PNT | Panthermetals | 0% | 0% | -14% | -44% | -55% | 0.105 | $3,228,750 |
| TUL | Tulla Resources | 0% | -3% | 19% | -4% | -48% | 0.32 | $102,977,281 |
| CLZ | Classic Min | 0% | 0% | -50% | -89% | -99% | 0.001 | $5,426,262 |
| ORN | Orion Minerals | 0% | -6% | 25% | -6% | -42% | 0.015 | $81,986,412 |
| TMS | Tennant Minerals | 0% | -6% | 7% | 3% | -40% | 0.032 | $24,301,869 |
| PXX | Polarx Limited | 0% | -13% | 17% | -30% | -30% | 0.014 | $18,941,257 |
| CYL | Catalyst Metals | -1% | -3% | 5% | -16% | -46% | 0.995 | $174,684,823 |
| EMR | Emerald Res NL | -1% | 5% | 20% | 52% | 45% | 1.8 | $1,077,748,784 |
| SPQ | Superior Resources | -1% | -15% | -20% | -29% | -7% | 0.04 | $68,899,427 |
| PNR | Pantoro Limited | -1% | 1% | 20% | -26% | -78% | 0.071 | $218,075,081 |
| IVR | Investigator Res | -2% | -7% | 47% | 50% | -3% | 0.063 | $91,978,881 |
| LEX | Lefroy Exploration | -2% | 0% | 35% | 12% | -12% | 0.29 | $47,335,111 |
| AUC | Ausgold Limited | -2% | -4% | 0% | 9% | -33% | 0.051 | $117,665,561 |
| GCY | Gascoyne Res | -2% | 4% | 28% | -24% | -48% | 0.1275 | $90,172,954 |
| SPD | Southernpalladium | -2% | 0% | -3% | -38% | 0% | 0.5 | $21,969,947 |
| ASO | Aston Minerals | -2% | -13% | -4% | 20% | -36% | 0.096 | $109,243,632 |
| SXG | Southern Cross Gold | -2% | -8% | 2% | -14% | 0% | 0.685 | $62,878,176 |
| CHN | Chalice Mining | -2% | -2% | 23% | 23% | 10% | 7.75 | $2,981,461,776 |
| RDT | Red Dirt Metals | -2% | 8% | 49% | -4% | -21% | 0.455 | $206,974,983 |
| MGV | Musgrave Minerals | -2% | 0% | 13% | 7% | -37% | 0.225 | $135,977,828 |
| MEK | Meeka Metals Limited | -2% | -12% | 2% | -34% | -6% | 0.045 | $49,110,011 |
| GMD | Genesis Minerals | -2% | 6% | 25% | 6% | -16% | 1.33 | $646,826,759 |
| SLZ | Sultan Resources | -2% | 0% | -9% | -52% | -74% | 0.041 | $4,337,944 |
| KAU | Kaiser Reef | -2% | 8% | 21% | 21% | -2% | 0.2 | $29,048,025 |
| G50 | Gold50Limited | -3% | -3% | -13% | -22% | -22% | 0.195 | $11,388,600 |
| AAJ | Aruma Resources | -3% | -9% | 37% | 47% | -32% | 0.078 | $12,556,920 |
| TIE | Tietto Minerals | -3% | -18% | -6% | -18% | 14% | 0.58 | $647,078,857 |
| MXR | Maximus Resources | -3% | -10% | 0% | -10% | -58% | 0.036 | $11,805,063 |
| TG1 | Techgen Metals | -3% | 0% | 6% | -15% | -50% | 0.07 | $4,630,402 |
| STN | Saturn Metals | -3% | -3% | 9% | -3% | -55% | 0.175 | $27,278,734 |
| KCC | Kincora Copper | -3% | 6% | 1% | -7% | -35% | 0.068 | $8,348,219 |
| ZNC | Zenith Minerals | -3% | 7% | -16% | -40% | -64% | 0.16 | $58,031,497 |
| DRE | Dreadnought Resources | -3% | -14% | 3% | -40% | 43% | 0.063 | $215,327,334 |
| CEL | Challenger Exp | -3% | -3% | 19% | -11% | -54% | 0.155 | $177,063,740 |
| HCH | Hot Chili | -3% | -2% | 22% | 23% | -35% | 1.075 | $132,584,179 |
| USL | Unico Silver Limited | -3% | -18% | 4% | -18% | -40% | 0.14 | $36,156,789 |
| HMX | Hammer Metals | -4% | -13% | 55% | 21% | -16% | 0.082 | $69,819,625 |
| AMI | Aurelia Metals | -4% | 0% | 29% | 8% | -71% | 0.135 | $173,241,210 |
| CY5 | Cygnus Metals | -4% | -2% | 18% | -32% | 53% | 0.26 | $50,523,537 |
| ERM | Emmerson Resources | -4% | -4% | 7% | 3% | -33% | 0.077 | $43,576,783 |
| MTC | Metalstech | -4% | 32% | 4% | -29% | 25% | 0.37 | $68,320,017 |
| NSM | Northstaw | -4% | -8% | -14% | -23% | -57% | 0.12 | $15,015,875 |
| PDI | Predictive Disc | -4% | 0% | 6% | 0% | -12% | 0.18 | $335,722,259 |
| BM8 | Battery Age Minerals | -4% | 0% | -1% | -30% | -30% | 0.35 | $27,089,629 |
| SMI | Santana Minerals | -4% | -12% | -6% | 5% | -9% | 0.69 | $107,119,871 |
| SAU | Southern Gold | -4% | 10% | 0% | -8% | -55% | 0.023 | $7,206,847 |
| FAL | Falconmetals | -4% | -14% | -6% | 20% | 3% | 0.335 | $61,950,000 |
| HMG | Hamelingoldlimited | -4% | 10% | 11% | -24% | -31% | 0.11 | $12,650,000 |
| VRC | Volt Resources | -5% | 5% | 0% | -30% | -61% | 0.0105 | $43,333,663 |
| IGO | IGO Limited | -5% | -4% | 11% | -1% | -2% | 13.325 | $10,579,031,348 |
| EMC | Everest Metals Corp | -5% | 12% | 9% | -4% | -46% | 0.076 | $10,354,649 |
| CPM | Coopermetalslimited | -5% | -8% | 27% | 49% | -22% | 0.35 | $15,268,290 |
| LCY | Legacy Iron Ore | -6% | 13% | 13% | -11% | -39% | 0.017 | $115,322,872 |
| PUR | Pursuit Minerals | -6% | -11% | -15% | 6% | -43% | 0.017 | $46,553,359 |
| MI6 | Minerals260Limited | -6% | -7% | 30% | 22% | -13% | 0.415 | $102,960,000 |
| ARV | Artemis Resources | -6% | 0% | 14% | -36% | -76% | 0.016 | $26,544,112 |
| MDI | Middle Island Res | -6% | -6% | -24% | -16% | -79% | 0.032 | $4,162,220 |
| TCG | Turaco Gold Limited | -6% | -10% | -6% | 5% | -42% | 0.061 | $27,801,583 |
| ARL | Ardea Resources | -6% | -11% | -24% | -46% | -79% | 0.38 | $69,458,623 |
| WWI | West Wits Mining | -6% | -17% | 15% | -6% | -56% | 0.015 | $35,888,276 |
| CLA | Celsius Resource | -6% | -6% | 0% | -6% | -40% | 0.015 | $29,963,493 |
| BTR | Brightstar Resources | -6% | 7% | -6% | -12% | -50% | 0.015 | $13,322,061 |
| TGM | Theta Gold Mines | -6% | -15% | 34% | 10% | -42% | 0.075 | $49,852,154 |
| GRL | Godolphin Resources | -7% | -5% | 29% | -1% | -41% | 0.082 | $10,416,511 |
| MRZ | Mont Royal Resources | -7% | -8% | -41% | -47% | -75% | 0.092 | $6,779,784 |
| BBX | BBX Minerals | -7% | -10% | -31% | -28% | -42% | 0.076 | $41,469,161 |
| AAU | Antilles Gold | -8% | -8% | -8% | 13% | -48% | 0.034 | $18,030,501 |
| AZS | Azure Minerals | -8% | -8% | 38% | 71% | 8% | 0.385 | $163,899,150 |
| ANX | Anax Metals | -8% | -6% | 5% | 23% | -48% | 0.065 | $29,067,033 |
| TRM | Truscott Mining Corp | -9% | -9% | -9% | 5% | -14% | 0.043 | $7,856,382 |
| SRN | Surefire Rescs NL | -9% | -9% | -9% | 75% | -30% | 0.021 | $36,371,360 |
| ASR | Asra Minerals | -9% | -5% | -17% | -50% | -64% | 0.01 | $16,138,305 |
| NAG | Nagambie Resources | -9% | -19% | -17% | -41% | -22% | 0.039 | $23,034,833 |
| KZR | Kalamazoo Resources | -10% | -18% | 0% | -33% | -70% | 0.14 | $23,419,037 |
| M2R | Miramar | -10% | 0% | 5% | -44% | -78% | 0.045 | $3,906,087 |
| STK | Strickland Metals | -10% | -18% | 0% | -10% | -46% | 0.036 | $62,197,684 |
| DTR | Dateline Resources | -11% | 0% | -11% | -54% | -87% | 0.017 | $12,232,572 |
| PRS | Prospech Limited | -11% | -32% | 4% | -7% | -52% | 0.025 | $2,843,215 |
| OZM | Ozaurum Resources | -11% | -3% | 38% | -12% | -63% | 0.058 | $8,255,000 |
| CDR | Codrus Minerals | -12% | -4% | 22% | -15% | 21% | 0.11 | $5,053,750 |
| BYH | Bryah Resources | -13% | -13% | 11% | -19% | -63% | 0.021 | $6,750,083 |
| M24 | Mamba Exploration | -13% | -13% | 38% | -28% | -30% | 0.105 | $7,318,001 |
| TMB | Tambourahmetals | -16% | -16% | 21% | 0% | -61% | 0.105 | $5,149,075 |
| TMX | Terrain Minerals | -17% | -17% | 0% | -17% | -55% | 0.005 | $6,499,196 |
| SIH | Sihayo Gold Limited | -20% | 0% | 0% | 0% | -33% | 0.002 | $15,255,320 |
| MTH | Mithril Resources | -20% | 0% | 0% | -43% | -78% | 0.002 | $8,157,725 |
| NES | Nelson Resources. | -20% | -20% | -33% | -43% | -78% | 0.004 | $2,942,972 |
| NXM | Nexus Minerals | -21% | -23% | -18% | -33% | -59% | 0.135 | $55,327,063 |
Small Cap Standouts
GBM RESOURCES (ASX:GBZ)
GBZ offloaded its remaining 50% share of the non-core Malmsbury gold project to Novo Resources (TSX:NVO) for $1m cash and 4m NVO shares (worth ~$1.5m at current prices).
It also keeps a 2.5% net smelter royalty (NSR), which is a percentage of revenue the company could receive in the future from gold sales.
For GBZ, it’s a zero-risk way to retain exposure to the project.
Its focus is on the Drummond Basin in Queensland where it has expanded JORC resources to ~1.84Moz of gold across the Mt Coolon, Yandan and Twin Hills projects.
In October last year it inked a $25m farm-in agreement with gold giant Newcrest (ASX:NCM) over the 330,000oz Mt Coolon.
The deal frees up GBZ to focus its efforts (and money) on Twin Hills and Yandan, which have a combined resource of ~1.38Moz.
2023 will see an expanded drilling program “which is aiming to define 2-3Moz and support GBZ’s transition into a mid-tier Australian gold company”, it says.
ORA BANDA MINING (ASX:OBM)
The junior gold miner has made a “significant lithium discovery” at its Davyhurst project in the WA goldfields.
OBM’s main game remains gold, but as part of a ‘3-Year Strategy to Create Value from investing in Exploration’, a small team is focussed on lithium.
OBM has historically struggled to make a go of its troubled Davyhurst gold operation near Kalgoorlie.
Ongoing cost and performance issues prompting the company to initiate a strategic review and ‘reset’ of its operations earlier last year.
It has now offloaded $14.2m worth of non-core projects and approved development of the 303,000oz at 4.1g/t Riverina Underground, which is fully funded.
Steady state production is pencilled in for Q4, FY24, when it will churn out ~600,000t of ore per annum at estimated all in sustaining costs of less than $1,650/oz.
The aspiring 100,000ozpa miner has rebounded strongly with a 430% gain since MD Luke Creagh, a veteran mining engineer who was COO at Australia’s #2 gold miner Northern Star Resources (ASX:NST), took control mid last year.
The post Gold Digger: The last time interest in buying gold and silver was this high, the global economy was collapsing appeared first on Stockhead.
tsx
asx
ax
gold
silver
lithium
iron
tsx-nvo
novo-resources-corp
tsx-ssrm
ssr-mining-inc
ssr mining inc


Dolly Varden consolidates Big Bulk copper-gold porphyry by acquiring southern-portion claims – Richard Mills
2023.12.22
Dolly Varden Silver’s (TSXV:DV, OTCQX:DOLLF) stock price shot up 16 cents for a gain of 20% Thursday, after announcing a consolidation of…
GoldTalks: Going big on ASX-listed gold stocks
Aussie investors are spoiled for choice when it comes to listed goldies, says Kyle Rodda. Here are 3 blue chips … Read More
The post GoldTalks: Going…
Gold Digger: ‘Assured growth’ – central bank buying spree set to drive gold higher in 2024
Central banks will drive the price of gold higher in 2024, believe various analysts Spot gold prices seem stable to … Read More
The post Gold Digger:…