Energy & Critical Metals
Lithium Americas Corp. (LAC): What Technical Indicators Show
Lithium Americas Corp. (NYSE:LAC) saw an upside of 10.36% to close Tuesday at $25.89 after adding $2.43 on the day. The 5-day average trading volume is…

Lithium Americas Corp. (NYSE:LAC) saw an upside of 10.36% to close Tuesday at $25.89 after adding $2.43 on the day. The 5-day average trading volume is 5,080,860 shares of the company’s common stock. It has gained $26.85 in the past week and touched a new high 2 times within the past 5 days. An average of 3,513,090 shares of the company has been traded in the last 20 days, and the 50-day average volume stands at 2,596,830.
LAC’s 1-month performance is 36.69% or $6.95 on its low of $18.36 reached on 01/10/23. The company’s shares have touched a 52-week low of $17.58 and high of $40.39, with the stock’s rally to the 52-week high happening on 02/07/23. YTD, LAC has achieved 36.62% or $6.94 and has reached a new high 13 times. However, the current price is down -35.90% from the 52-week high price.
Valuation Metrics
LAC stock has a beta of 1.49. Moving on to other valuation ratios, the price-to-book (PB) in the most recent quarter is 4.51.
Lithium Americas Corp.’s quick ratio for the period ended September 29 was 52.10, with the current ratio over the same period at 52.10. As well, the company’s long term debt to equity for the quarter ending September 29 was 0.31, while the total debt to equity was 0.31.
Earnings Surprise
For the quarterly period ending September 29 this year, Net income and sales went down compared to those figures reported in the previous quarter. Analysts expected LAC to announce -$0.16 per share in earnings in its latest quarter, but it posted -$0.3, representing a -87.50% surprise. EBITDA for the quarter stood at more than -$24.57 million. LAC stock balance sheet for the quarter ending September 29 shows that total liabilities totaled 251.26 million, with total debt at $216.03 million.
Let’s look briefly at Lithium Americas Corp. (LAC) price momentum from a technical analysis perspective. The 9-day relative strength index as at close on 07 February was 70.24% to suggest the stock is trending Overbought, with historical volatility in this time period at 89.88%.
The stock’s 5-day moving average is $24.67, reflecting a +2.62% or $0.66 change from its current price. LAC is currently trading +35.76% above its 20-day SMA, -18.33% above its 100-day SMA. However, the stock’s current price level is away from the SMA50 by -1.93% and SMA200 by-6.30%.
Stochastic %K and %D was 77.95% and 81.13% and the average true range (ATR) pointed at 1.46. The RSI (14) points at 66.56%, while the 14-day stochastic is at 87.04% with the period’s ATR at 1.34. The stock’s 9-day MACD Oscillator is pointing at 0.65 and 1.57 on the 14-day charts.
Analyst Ratings
In the most recent analyst report for Lithium Americas Corp. (NYSE: LAC), Evercore ISI launched coverage with an Outperform rating.


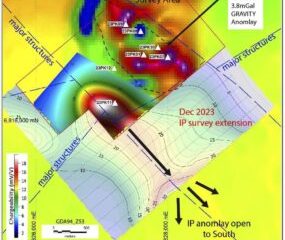


Uranium Exploration Company Announces Additional Staking in the Athabasca Basin
Source: Streetwise Reports 12/22/2023
Skyharbour Resources Ltd. announced an update from its Canada-based Falcon Project along with additional…
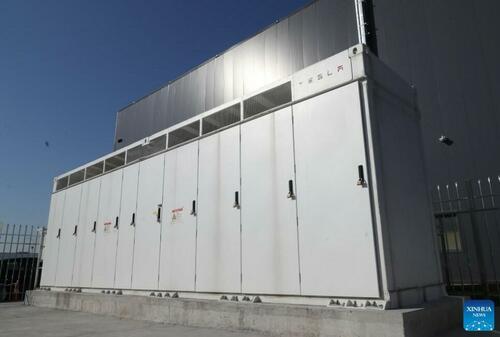
Tesla Launches New Mega Factory Project In Shanghai, Designed To Manufacture 10,000 Megapacks Per Year
Tesla Launches New Mega Factory Project In Shanghai, Designed To Manufacture 10,000 Megapacks Per Year
Tesla has launched a new mega factory…
Giving thanks and taking stock after “a remarkable year”
An end-of-year thank you to our readers, industry colleagues and advertisers before Electric Autonomy breaks from publishing until Jan. 2
The post Giving…