Disclaimer: opinions are personal to the author and do not reflect the opinions of Exness or LeapRate.
Precious Metals
Weekly data: Oil and Gold price action following the failure of three US banks
On the technical side the end of the bearish symmetrical triangle is in sight without any clear signal yet as to where the price will head. The Stochastic…


On the technical side the end of the bearish symmetrical triangle is in sight without any clear signal yet as to where the price will head. The Stochastic oscillator is not showing any overbought or oversold levels while the cross of the 50 day moving average above the 100 day moving average gives some indications of bullish momentum.
In any case the levels of $78 and $74 are strong resistance and support levels respectively with the resistance consisting of the 50 and 100 moving average lines and the latter consisting of the lower band of the Bollinger bands as well as the lower boundary of the triangle formation.
Gold-dollar, daily
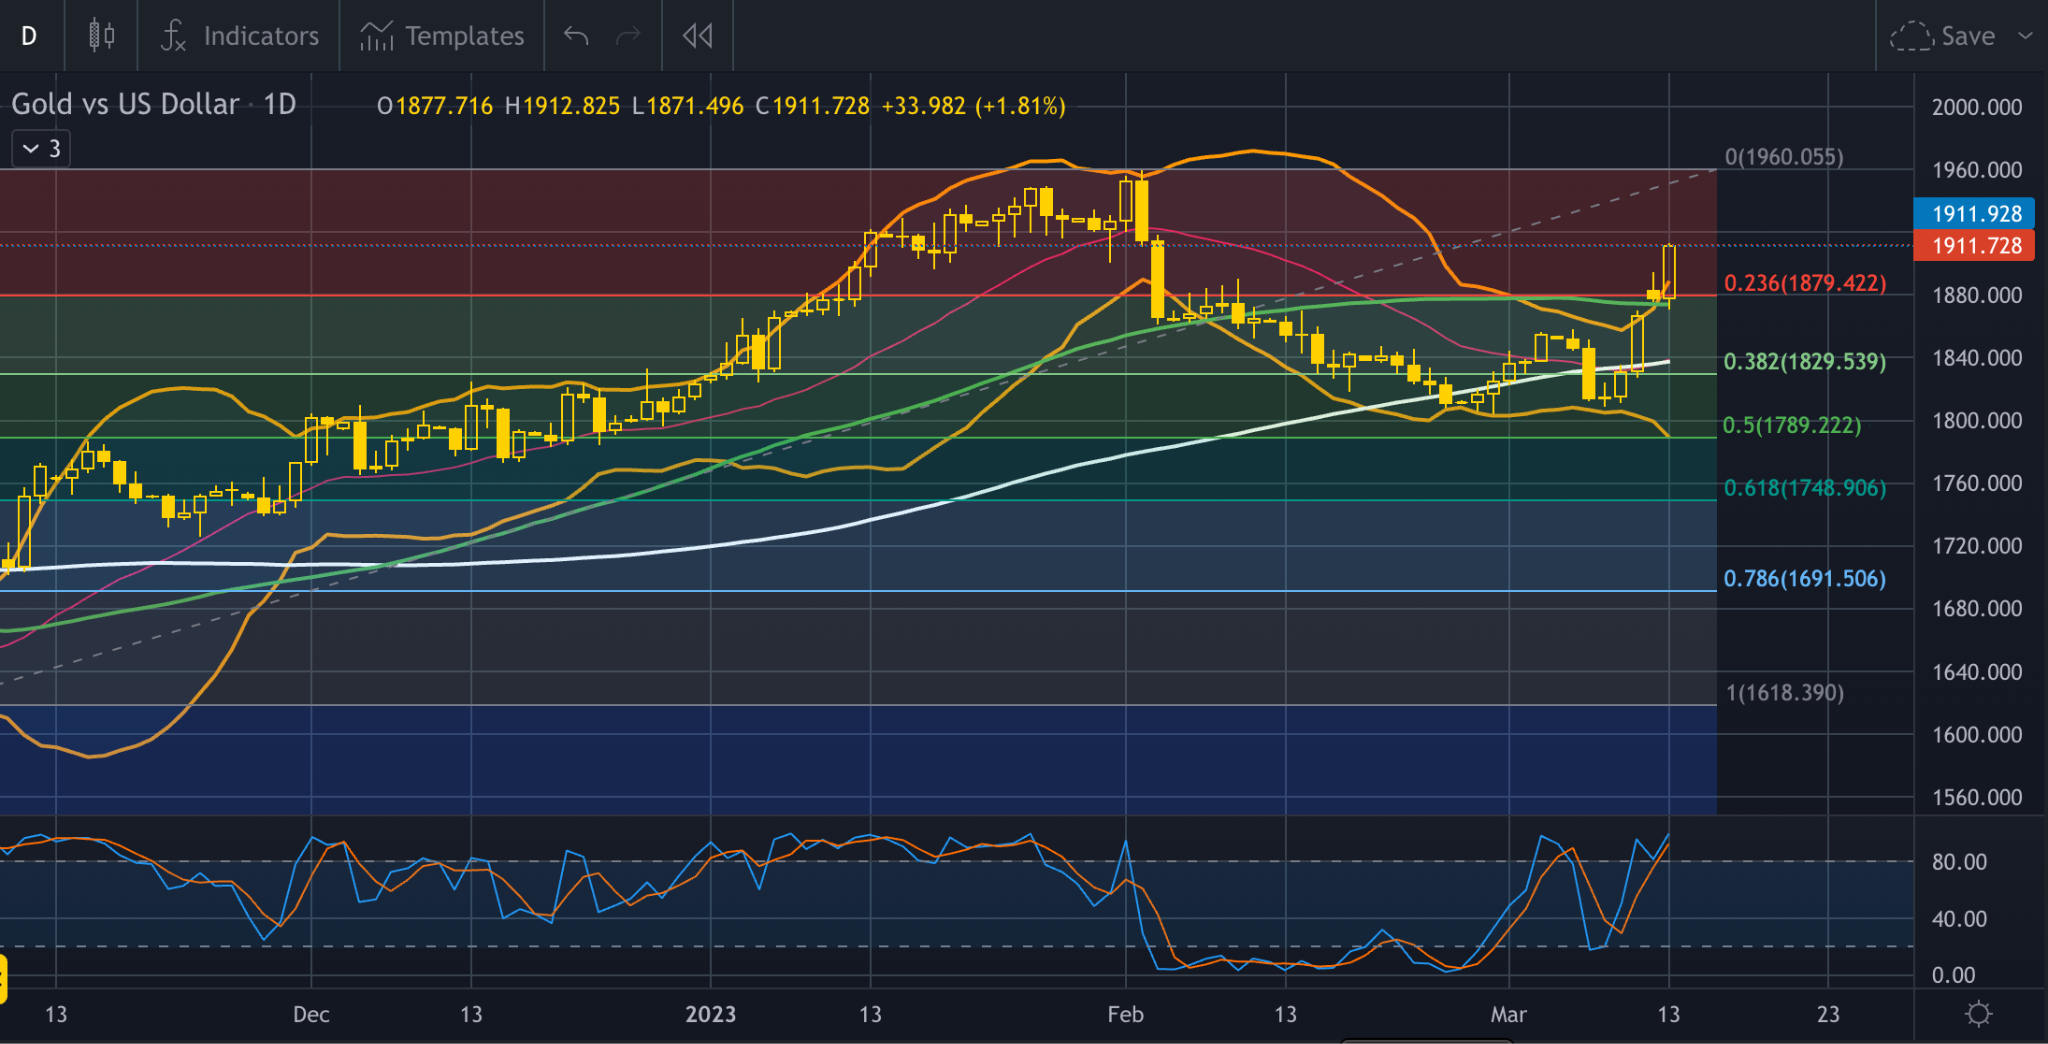
Gold has been traditionally considered a safe haven asset in times of uncertainty and this is what is currently happening on the market following the failure of three banks last week. After recent events of banks stopping their operations the price of gold made gains as its an attractive addition to investor’s portfolios because of its relative “stability” to balance out the uncertainty that is currently holding strong throughout the markets. The Federal Reserve might also slow down their pace of rate hikes and this can also be seen on the fedwatch tool with the probability of no hike being more than 35%. This was not a scenario until Friday March 10th but is now gaining more ground coming up to the next FED meeting on March 22nd.
From the technical point of view the price is trading above the upper band of the Bollinger bands indicating great volatility in the market for gold while the 50 day moving average is trading above the 100 day moving average further supporting the bullish momentum which is in effect. The Stochastic oscillator is in the extreme overbought levels but this can add little worry to the extreme bullish movement of the yellow metal.
With the majority of the technical indicators showing a bullish image the most probable scenario in the short term is for the price to continue traveling North on the chart with a first point of possible resistance around the $1,960 price area which is an inside resistance level since early February. In the event of a correction to the downside the first point of possible support might be found around $ 1,880 where is the crossing of the 50 day moving average, the upper band of the Bollinger bands and the 23.6% of the daily Fibonacci retracement level.
The post Weekly data: Oil and Gold price action following the failure of three US banks appeared first on LeapRate.


Canadian Silver Co. Will See Big Changes in 2024
Source: Michael Ballanger 12/22/2023
Michael Ballanger of GGM Advisory Inc. takes a look at the current state of the market and shares on stock…
EGR options out Urban Berry project in Quebec to Harvest Gold – Richard Mills
2023.12.23
EGR Exploration Ltd. (TSXV: EGR) has moved from owner to shareholder at its Urban Berry project in Quebec, this week announcing it is optioning…
Crypto, Crude, & Crap Stocks Rally As Yield Curve Steepens, Rate-Cut Hopes Soar
Crypto, Crude, & Crap Stocks Rally As Yield Curve Steepens, Rate-Cut Hopes Soar
A weird week of macro data – strong jobless claims but…


