Economics
EUR/NZD Technical – Potential start of new bullish impulsive up move
The Kiwi dollar (NZD) has been the worst performer among the US dollar major pairs in the past five days. A further slowdown in New Zealand’s Q3 CPI…
- The Kiwi dollar (NZD) has been the worst performer among the US dollar major pairs in the past five days.
- A further slowdown in New Zealand’s Q3 CPI (5.6% y/y versus 6% y/y in Q2) reinforces RBNZ’s current stance of maintaining its key policy official cash rate unchanged at 5.5%.
- A less hawkish RBNZ may put further downside pressure on the NZD that supports an ongoing major uptrend phase in the EUR/NZD cross pair.
- Watch the 1.7820 key short-term pivotal support on the EUR/NZD.
The Kiwi dollar (NZD) has been the weakest performer among the US dollar major pairs ex-post New Zealand’s general election held over the weekend which saw a change in government towards the centre-right National Party.
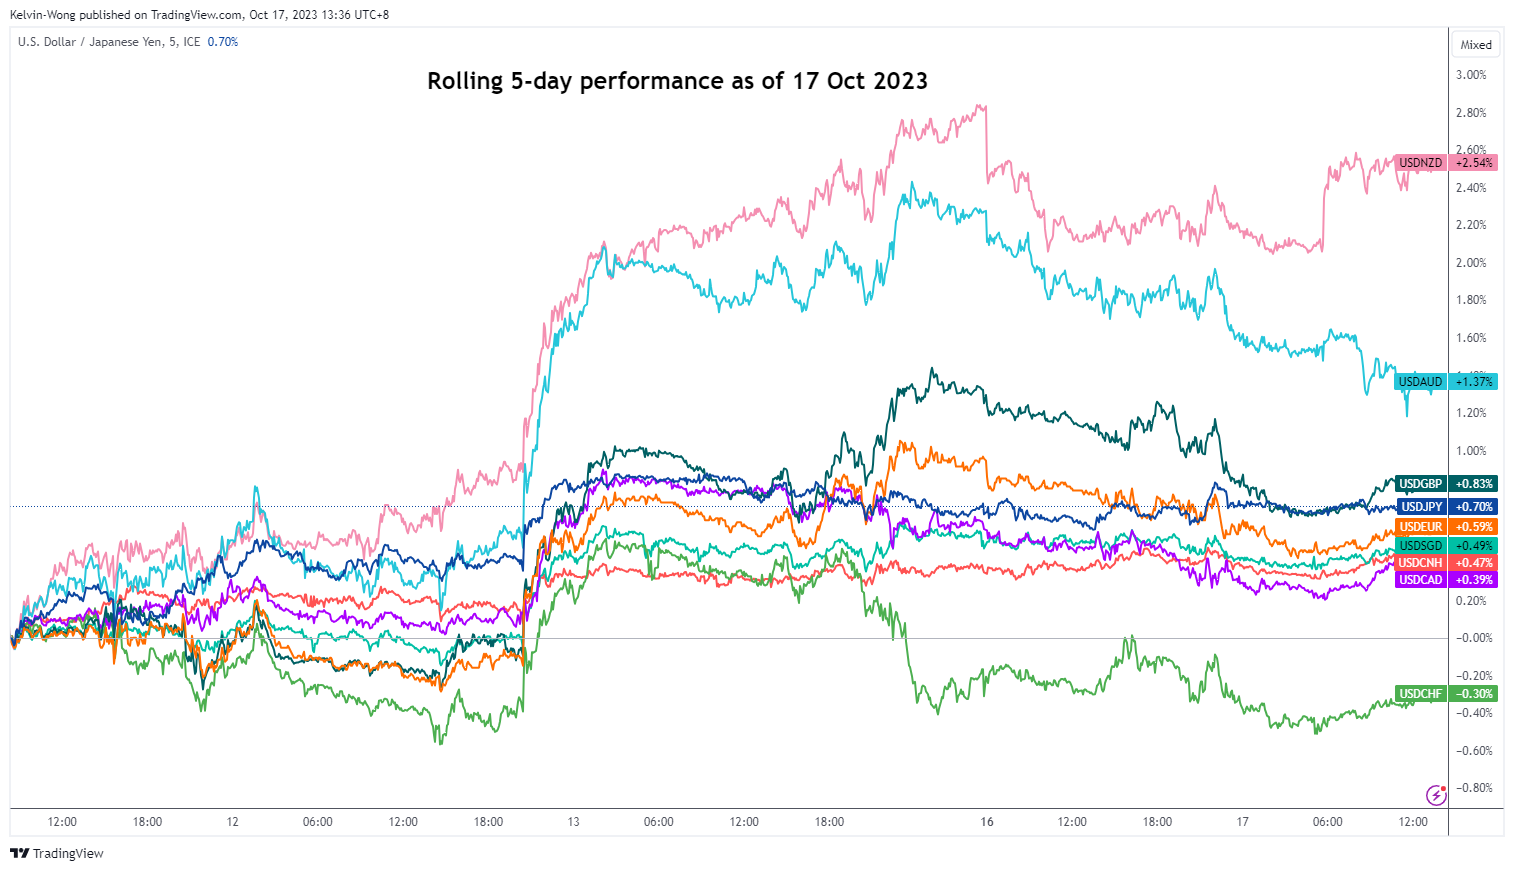
Fig 1: USD major pairs rolling 5-day performance as of 17 Oct 2023 (Source: TradingView, click to enlarge chart)
Based on a 5-day rolling performance basis as of 17 October 2023, the USD/NZD has recorded a gain of +2.5% at this time of the writing reinforced by a slowdown in inflationary pressures in New Zealand where its Q3 consumer inflation rate released today inched down to 5.6% y/y from 6% y/y in Q2 and below consensus expectations of 5.9% y/y.
This latest set of CPI data marks the third consecutive quarter of inflationary pressures cooldown from a 22-year high of 7.3% y/y printed in Q2 2022 that supports New Zealand’s central bank, RBNZ current stance of keeping the official cash rate unchanged at 5.5% for a period of time, so far it has held the policy rate steady for three consecutive monetary policy meetings with next upcoming meeting on 29 November.
The ongoing weak performance of the USD/NZD against other US dollar major pairs has led to a resurgence of bullish impulsive sequences in several variable quoted NZD cross pairs such as the EUR/NZD.
Bullish reversal right at major ascending channel support
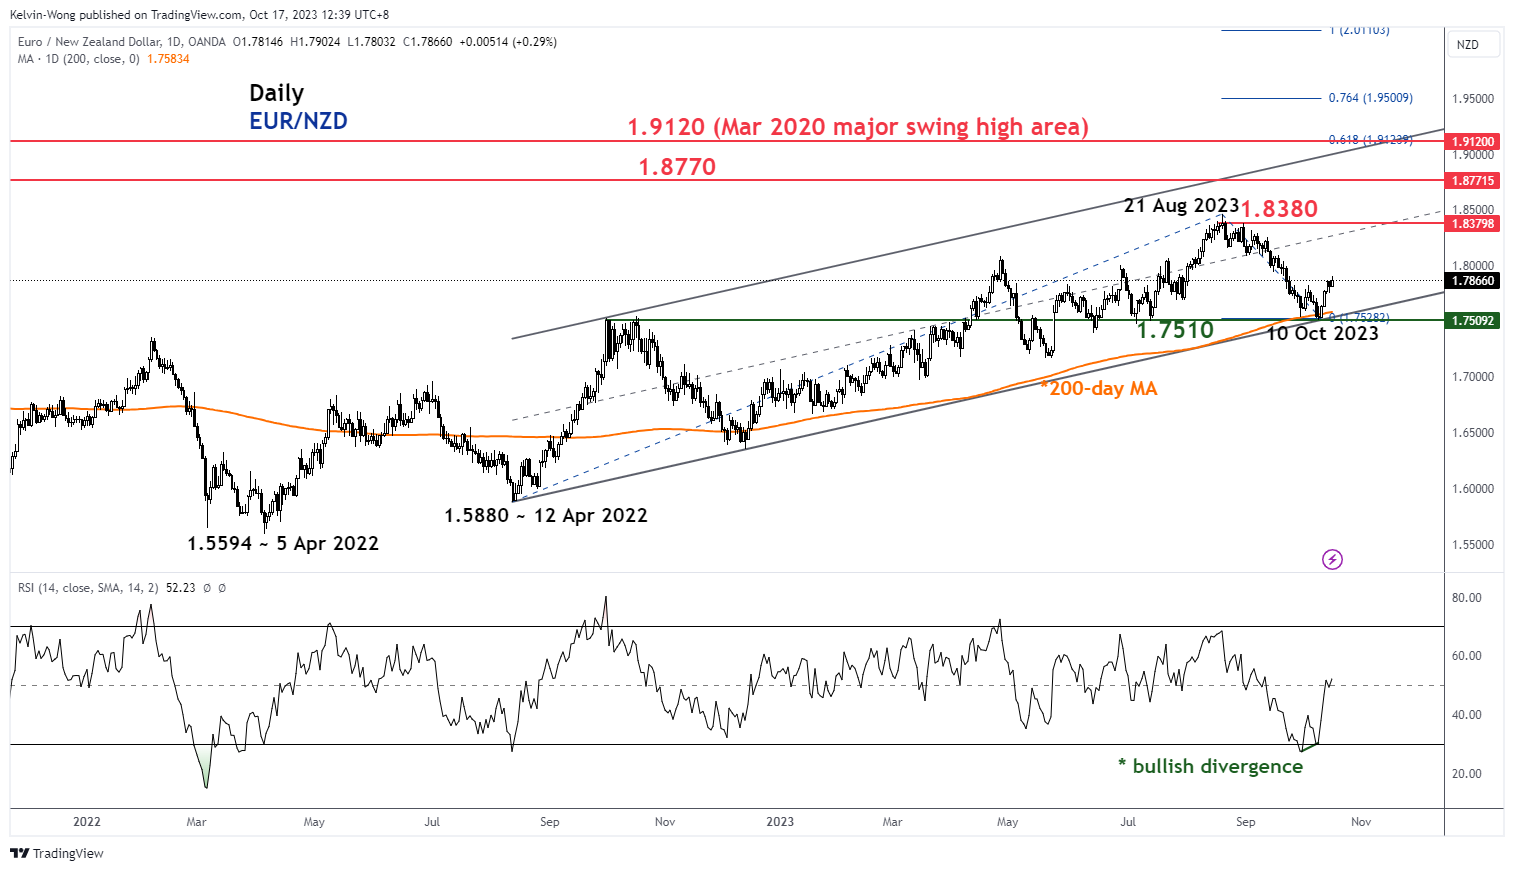
Fig 2: EUR/NZD major & medium-term trends as of 17 Oct 2023 (Source: TradingView, click to enlarge chart)
The 7-week of corrective decline seen in the EUR/NZD cross pair from its 21 August 2023 high of 1.8462 to its recent 10 October 2023 low of 1.7508 is likely to have ended where price actions staged a significant bullish reversal of + 336 pips in a span of five days right at a key medium-term support of 1.7510 that confluences with the key upward sloping 200-day moving average and the lower boundary of the major ascending channel in place since 12 April 2022 low of 1.5880.
In conjunction, the daily RSI indicator flashed a prior bullish divergence condition at its overbought region on 9 October and now inched higher above the 50 level. These observations suggest the potential revival of medium-term bullish momentum where price actions of the EUR/NZD may kick start of fresh multi-week bullish impulsive up move sequence within its major uptrend phase that is still intact since the April 2022 low of 1.5594.
Cleared above 20-day moving average
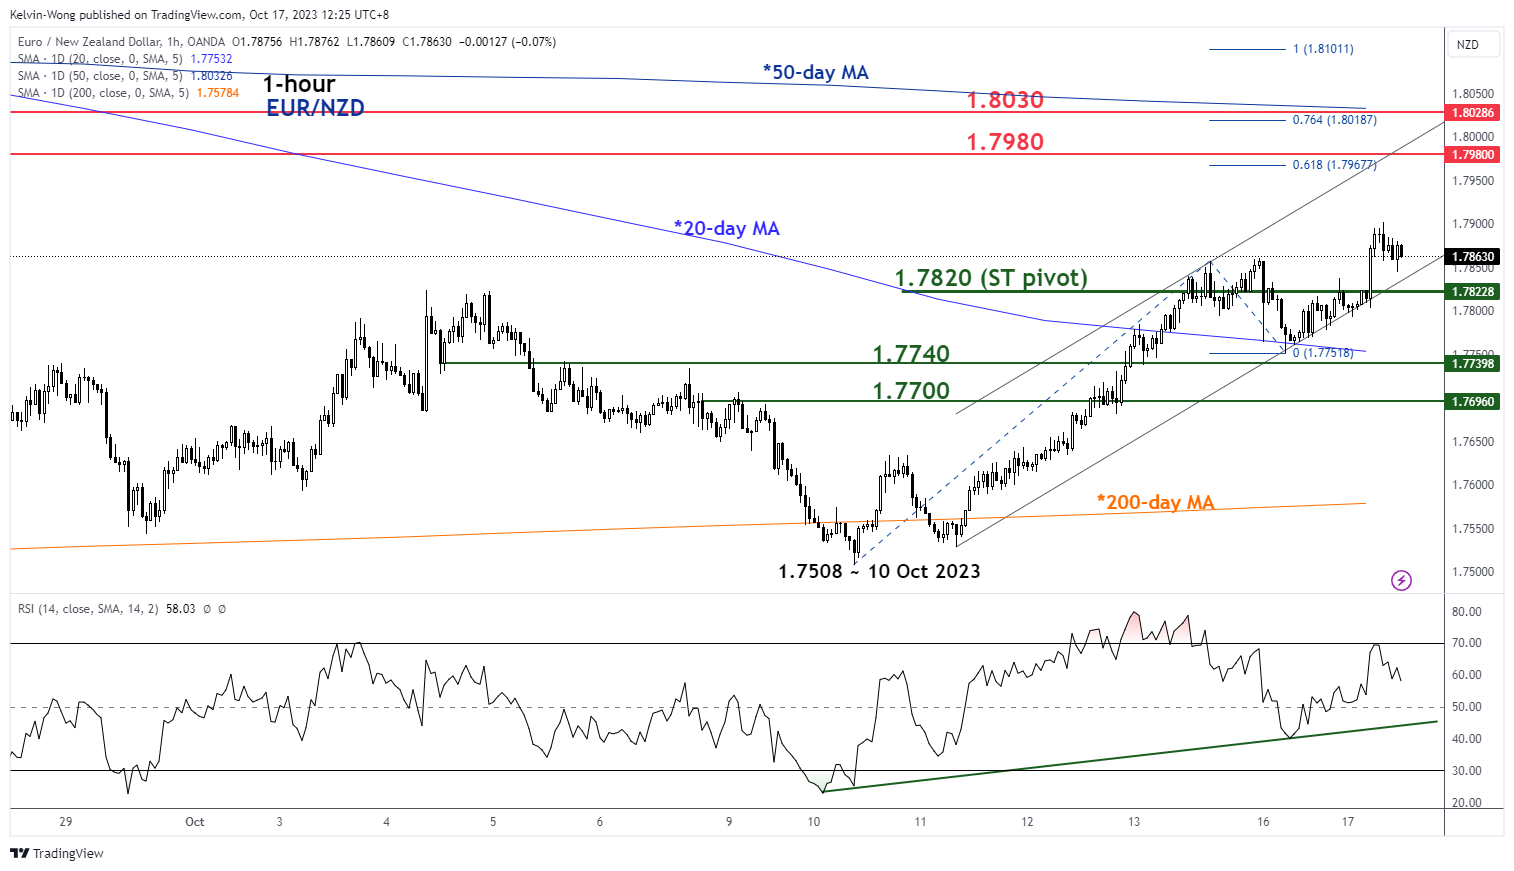
Fig 3: EUR/NZD minor short-term trend as of 17 Oct 2023 (Source: TradingView, click to enlarge chart)
The EUR/NZD has also cleared above its 20-day moving average and retested it yesterday, 16 October before it inched up to print a “higher high” as seen on the 1-hour chart.
This current set of up moves suggests that the EUR/NZD is likely to be oscillating within a short-term uptrend phase in place since 10 October 2023 depicted by the minor ascending channel.
Watch the 1.7820 key short-term pivotal support to maintain the bullish tone for the next intermediate resistances to come in at 1.7980 and 1.8030 (50-day moving average, the upper boundary of the minor ascending channel and Fibonacci extension level).
On the flip side, a break below 1.7820 negates the bullish tone for a slide back to retest the immediate support zone of 1.7740/1.7700 (20-day moving average and 50% Fibonacci retracement of the current up move from 10 October 2023 low to 17 October 2023 current intraday high of 1.7902).
dollar
inflation
monetary
policy
central bank
us dollar
monetary policy
inflationary


Argentina Is One of the Most Regulated Countries in the World
In the coming days and weeks, we can expect further, far‐reaching reform proposals that will go through the Argentine congress.

Crypto, Crude, & Crap Stocks Rally As Yield Curve Steepens, Rate-Cut Hopes Soar
Crypto, Crude, & Crap Stocks Rally As Yield Curve Steepens, Rate-Cut Hopes Soar
A weird week of macro data – strong jobless claims but…

Fed Pivot: A Blend of Confidence and Folly
Fed Pivot: Charting a New Course in Economic Strategy Dec 22, 2023 Introduction In the dynamic world of economics, the Federal Reserve, the central bank…


