Precious Metals
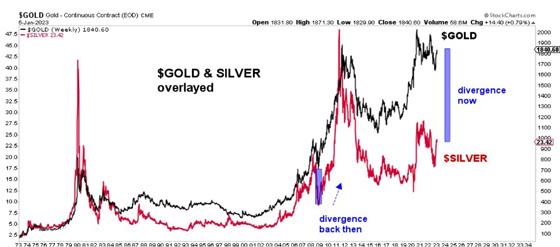
Divergences in Ratios Show Silver Is Undervalued
Last week, Citigroup analysts published a report calling for silver to reach $30 per ounce within 9 months. Could Citigroup be exaggerating or on target?…
Last week, Citigroup analysts published a report calling for silver to reach $30 per ounce within 9 months.
Could Citigroup be exaggerating or on target? Today’s silver spot price is about $23.50 per ounce; so a move to $30.00 would be a 28% jump.
Let’s look at a few data sets that augur for higher silver prices…
Throughout human history, about 8.5 ounces of silver have been extracted from the earth for every one ounce of gold.
According to the World Gold Council, an estimated 208,874 tonnes of gold have been mined.
The distribution of gold above ground is as follows:
- Jewelry: 46%
- Bars and coins: 22%
- Central banks: 17%
- Other: 15%
According to the U.S. Geological Survey (USGS), about 1.74 million metric tons of silver have been mined.
Here are the top five uses of silver by percentage, including bullion, solar, jewelry, and electronics:
- Jewelry: 40%
- Electronics: 25%
- Industrial: 15%
- Bullion: 10%
- Other: (art, religious objects, currency) 10%
The gold-to-silver price ratio is influenced by supply-and-demand trends, macro-economic conditions, and investor sentiment. In particular, industrial demand is an enormous tailwind for silver.
Mining production: currently, the gold-to-silver ratio is nine ounces of silver mined for every ounce of gold. Meanwhile, the gold-to-silver price ratio average for the past 250 years is 40:1.
So now we get to the GREAT NEWS… Today, the gold-to-silver ratio is about 85:1.
That number screams there is something incredibly bullish looming.
Let’s look at who else is noticing and taking action to profit from this divergence.
On March 8, 2023, BlackRock Inc., the world’s largest asset manager, disclosed in a regulatory filing that it had purchased 16.1 million shares of the silver exchange-traded fund (ETF) Sprott Physical Silver Trust (PSLV), representing a whopping 10.9% stake in the fund.
There has been a lot of social media chatter about a silver squeeze and even social media movements trying to organize a syndicate of retail “stackers” to drain the COMEX inventory as a strategy for “sticking it to short sellers.”
But when institutional investors move into silver, it’s an explosive signal that significant gains are nigh.
The top 5 institutional investors are Blackrock, Vanguard, State Street Global Advisors, Fidelity Investments, and Capital Group. The combined assets of these five institutions are over $30 trillion.
These institutional investors manage various assets, including stocks, bonds, and real estate. They invest for multiple clients, including pension funds, insurance companies, and endowments.
In the past 20 years, these institutional investors have been on the sidelines or not really investing in gold or silver. This is mainly because the equity market has been on a massive bull run for decades.
Moreover, most fund managers are relatively young. They have not lived through a 1970s-style inflation cycle, nor did their finance schools teach classes on precious metals and investing.
Institutional investment has averaged under 0.5%, so moving to the historic mean of 3% would be a six times greater investment into silver and gold.
This is the real silver squeeze.
Getting back to the 85:1 gold-to-silver ratio; historically, when the spread gets this wide, silver can explode higher to close the gap in a short time.
Since January 2000, this has happened four times.
As stated previously, the average GSR in our modern era has been around 40:1.
Historically, the ratio has often moved sharply lower. And when it does, it does so fiercely, swiftly, and lucratively for those positioned before the move.
The ratio fell to 30:1 in 2011 and below 20:1 in 1979. Let’s just say it goes to 60:1 (padding it to be conservative). A gold price of $2,000 would translate into a silver price of over $33.
If, as many analysts predict, gold rises to $3,000 per ounce in the next up cycle, and the gold-to-silver ratio reverts to 40:1, silver would more than triple to $75.
That could still be a conservative price target for a raging silver bull market. Time will tell.
Silver has underperformed gold since 1973, especially since 2011.


Canadian Silver Co. Will See Big Changes in 2024
Source: Michael Ballanger 12/22/2023
Michael Ballanger of GGM Advisory Inc. takes a look at the current state of the market and shares on stock…
EGR options out Urban Berry project in Quebec to Harvest Gold – Richard Mills
2023.12.23
EGR Exploration Ltd. (TSXV: EGR) has moved from owner to shareholder at its Urban Berry project in Quebec, this week announcing it is optioning…
Crypto, Crude, & Crap Stocks Rally As Yield Curve Steepens, Rate-Cut Hopes Soar
Crypto, Crude, & Crap Stocks Rally As Yield Curve Steepens, Rate-Cut Hopes Soar
A weird week of macro data – strong jobless claims but…


