Economics
Gold Has Not Lost Its Glitter (Part 2)
Gold (XAU/USD) has dropped by -5.6% from its recent 52-week high of US$2,067. Recent price weakness of gold (XAU/USD) is due to the unwinding of potential…
- Gold (XAU/USD) has dropped by -5.6% from its recent 52-week high of US$2,067.
- Recent price weakness of gold (XAU/USD) is due to the unwinding of potential long hedges and large speculators’ positions ahead of a potentially positive outcome of the US debt ceiling extension negotiations.
- Longer-term factors such as global stagflation risk and technical analysis are still in favour of a potential multi-month bullish scenario for gold.
The bullish momentum of the shiny metal, gold (XAU/USD) seems to have dissipated in the recent weeks after it printed a fresh 52-week high of US$2,067 on 4 May 2023 and thereafter staged a decline of -5.6% to hit a low of US$1,952 on last Thursday, 18 May. Click here to read Part 1 of the previous analysis.
Even though last Friday, 19 May, the price actions of gold managed to stage a rebound of +1% to close the US session at US$1,977.90 but still below its 20 and 50-day moving averages that are acting as resistances at around US$2,008 and USS$1,990 respectively.
What are the factors that are driving this bout of ongoing weakness for gold?
Firstly, it is the drama that is playing out from Washington that is centered on the soon-to-be “X-date” US debt ceiling extension deadline that falls on 1 June 2023 where the US government is at high risk of running out of cash to meet its obligations if the current debt ceiling of US$31.4 trillion is not raised on 1 June.
The aftermath is a technical default that will likely see a credit downgrade on US sovereign bonds by credit rating agencies and triggered havoc in the global markets via a significant spike in US Treasury yields that may cause global liquidity conditions to tighten and even though such an occurrence happen for a short period before brinkmanship dissipates, its adverse impact can still spark a severe risk-off behaviour among market participants.
Hence, in anticipation of such a US government debt obligation default scenario that may occur on 1 June, long hedges and speculative positions have started to build up in the past two months in safe-haven assets such as gold.
Large speculators’ net open position in gold futures hit close to 1-year high
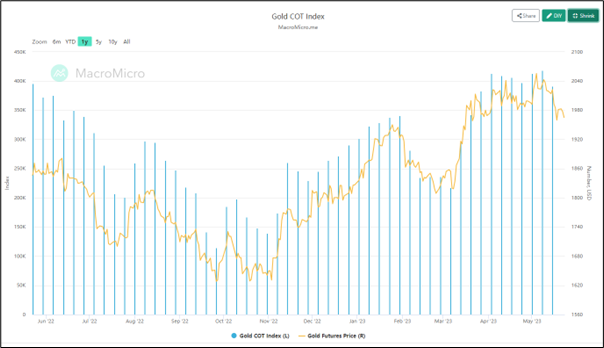
Fig 1: Gold futures net positioning trend as of 15 May 2023 (Source: MacroMicro, click to enlarge chart)
Based on the latest CFTC’s Commitments of Traders weekly report, the net open positions of large speculators in the gold futures market have increased steadily since the week of 31 October 2022. From the week of 3 April to 15 May 2023, these large speculators’ net long open positions have hovered close to a one-year high at around 395,000 contracts.
Thus, this observation on the net long open positioning of large speculators on leveraged gold-related instruments such as futures indicates a slight hint of medium-term over-optimism on the price of gold to march higher in the event of a US government default scenario.
Also in the past week, there were news reports that stated there were potential breakthroughs in the US debt ceiling limit extension negotiation talks between the Biden Administration and the House Republicans that may lead to some form of middle-ground trade-offs to agree to an extension on or before 1 June that has likely triggered some form unwinding of long hedges and speculation positions that dampen the prior bullish sentiment on gold.
Recent short-term bullish strength seen in the US dollar has reinforced gold’s weakness
In addition, the movement of the US dollar in general will tend to have an indirect correlation with gold. In the past two weeks, the US dollar has shown signs of a short-term bullish resurgence, measured by the US Dollar Index that has recorded a weekly gain of +1.4% for the week of 8 May 2023, its highest return since 19 September 2022 supported by a less dovish Fed Speak where the latest public speeches from several Federal Reserve officials have indicated a “not in favor consensus” to kickstart a fresh interest rate cut cycle in the second half of 2023.
On the contrary, there are still several long-term supporting factors that may spark another fresh round of rally in gold.
Global stagflation risk cannot be ruled out
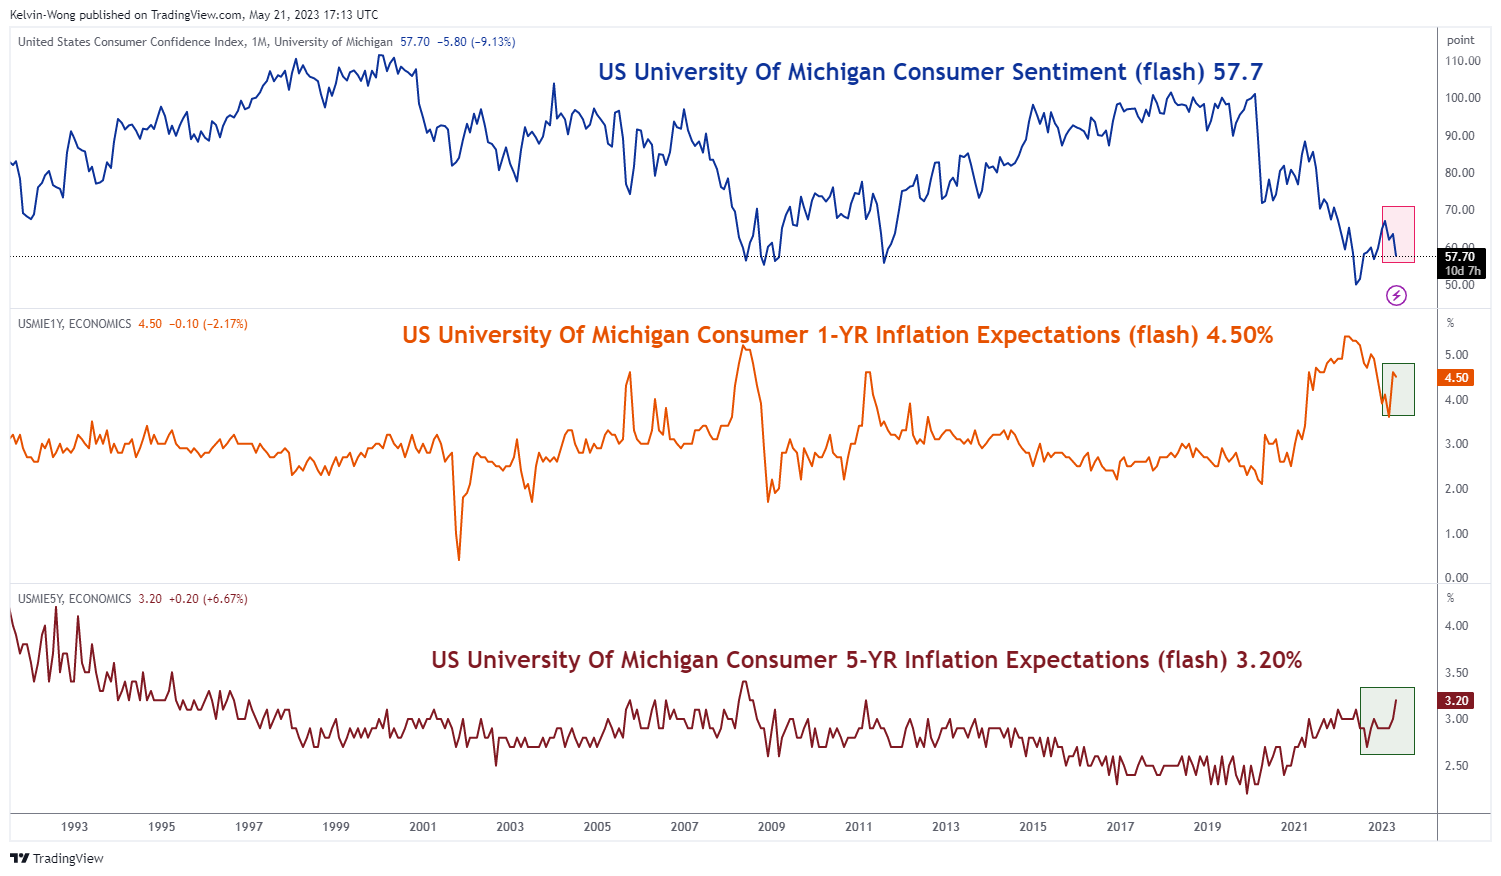
Fig 2: Preliminary University of Michigan US consumer sentiment & inflationary expectations for May
(Source: TradingView, click to enlarge chart)
Recent soft key leading economic data from the two largest economies, the US and China such as the Purchasing Managers’ Index (PMI) survey-based reports for April and the preliminary University of Michigan US consumer sentiment index for May have increased the odds of an impending global recession in the second half of the year.
Also, forward-looking inflationary pressures have appeared to be getting stickier; the preliminary University of Michigan US consumer 1-year inflation expectations reading for May have rebounded since March and remained elevated at 4.50%. In addition, the longer-term 5-year inflation expectations reading has spiked up to 3.20%, its highest level since March 2011.
Slower global growth and elevated sticky inflation is a toxic concoction that led to a stagflation environment where gold tends to outperform other asset classes in the past.
Technical analysis is still indicating a potential major uptrend in the making since September 2022 low
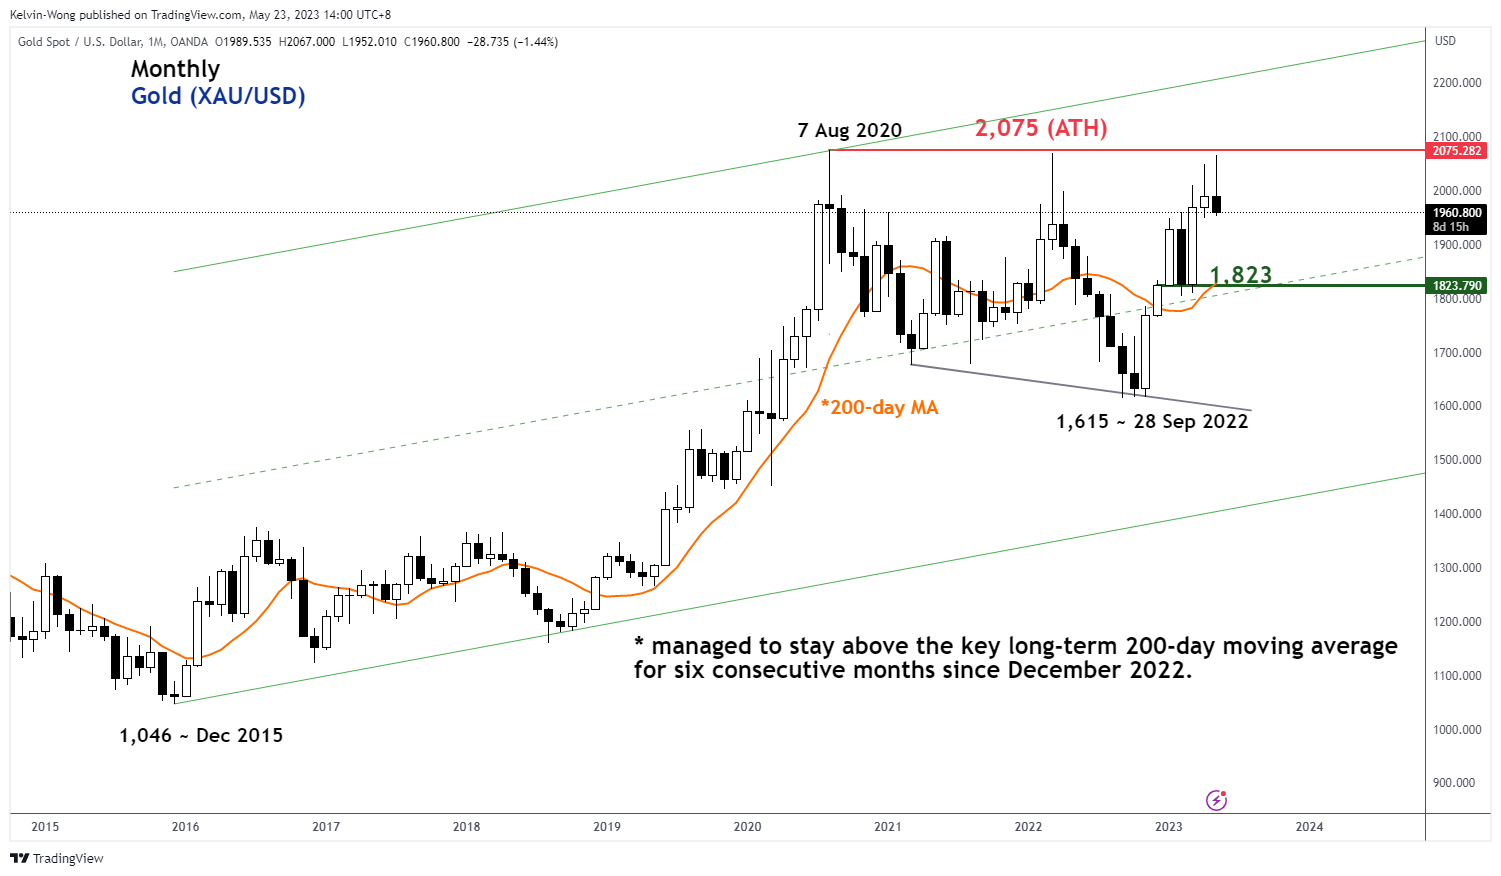
Fig 2: Gold (XAU/USD) trend as of 23 May 2023 (Source: TradingView, click to enlarge chart)
Even though the recent price actions of gold (XAU/USD) have failed to break above its current all-time high of US$2,075 printed in August 2020 on its second attempt in May 2023 with the first being in March 2022, it has managed to stay above the key long-term 200-day moving average for six consecutive months since December 2022.
This positive observation of its consecutive price actions’ duration above the 200-day moving average is the longest period recorded so far since a two-year plus consolidation from its August 2020 all-time high.
It indicates that a potential major uptrend phase is still evolving for gold since the September 2022 low of US$1,615 which may support further potential upside going forward.
dollar
gold
inflation
stagflation
markets
reserve
fed
correlation
us dollar
inflationary


Argentina Is One of the Most Regulated Countries in the World
In the coming days and weeks, we can expect further, far‐reaching reform proposals that will go through the Argentine congress.

Crypto, Crude, & Crap Stocks Rally As Yield Curve Steepens, Rate-Cut Hopes Soar
Crypto, Crude, & Crap Stocks Rally As Yield Curve Steepens, Rate-Cut Hopes Soar
A weird week of macro data – strong jobless claims but…

Fed Pivot: A Blend of Confidence and Folly
Fed Pivot: Charting a New Course in Economic Strategy Dec 22, 2023 Introduction In the dynamic world of economics, the Federal Reserve, the central bank…


