Precious Metals
Gold Pops on Market Chaos
Gold explodes higher as the banking sector reels…the Fed’s fight against inflation hits a wall…
Gold explodes higher as the banking sector reels … the Fed’s fight against inflation hits a wall … the U.S. consumer can’t save the economy … watch the S&P’s 200-day moving average
Years ago, a veteran investor told me, “you don’t own gold for gains, you own it as a hedge against chaos.”
In the wake of the banking sector meltdown, here’s what gold as a chaos-hedge looks like…
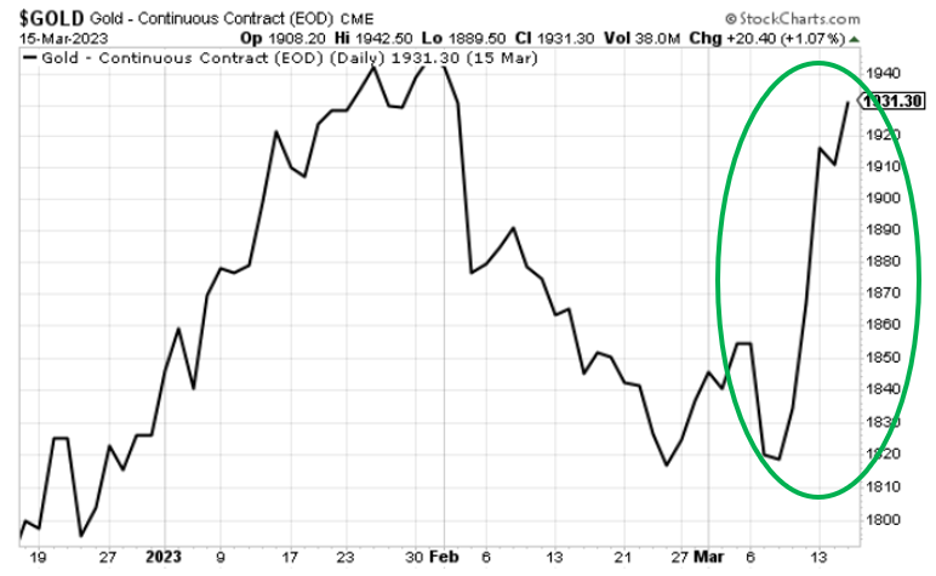 Source: StockCharts.com
But the interest in gold today isn’t solely due to banking-based fear rippling through the market.
It’s also because the Fed finds itself between a rock and a hard place, which amplifies uncertainty about the economic/investment landscape looking forward.
“Reports of my death are greatly exaggerated” – Inflation, 2023
While Mark Twain gets credit for the quote “reports of my death are greatly exaggerated,” it could be co-opted by inflation today.
Yes, inflation has come down significantly from its peak last summer, but this week’s CPI clocked in at 3X the Fed’s target inflation goal.
And while some bulls promote the idea that inflation will just “drift away” now that it’s on a downward trajectory, a more balanced perspective would be wise.
The overarching term “inflation” encompasses many different measures of price-changes in the economy. And while some of them are declining beautifully (we had a fantastic PPI report this week), many others are not.
Here’s Bloomberg on this, following this week’s CPI report:
…Headline CPI fell thanks to sharp declines in the price rises of energy and of core goods — the two sectors that drove the spike in the first place.
Persistent food inflation, over which monetary policy has little control, keeps the headline high, but the greatest driver now is in services, where price rises continue to pick up.
Digging through the measures that different branches of the Fed compile to grasp the breadth of inflation tends to confirm that generalized price pressure remain very high.
The Cleveland Fed’s measure of the trimmed mean (in which outlier components in either direction are discarded and an average taken of the rest) is barely below its January level, and still above 6%.
Its measure of the median has topped 7% for the first time.
 Source: Bloomberg In light of the unfortunate reality of sticky inflation, the Fed would probably be intensifying its effort to stamp out inflation by increasing its rate hike to 50 basis points next week
That’s not my own theory, that’s from Wall Street.
We know this because immediately prior to this week’s banking meltdown, the overwhelming odds were on the Fed raising rates by 50 basis points next Wednesday.
But after the banking sector melt-down, that went out the window. Majority odds are now on a 25-basis-point hike, with a minority expecting no hike.
I’m reminded of a quote that my fellow-Digest-writer, Luis Hernandez, used to begin one of his recent Digests. You can almost see the Fed watching the banking meltdown, then mumbling under its breath…
“Well, well, well, if it isn’t the consequences of my own actions.”
But as bulls pop the champagne bottles, there’s an obvious question…
What happens to inflation?
The analogy that comes to mind is the relationship between cancer and chemotherapy.
If the chemo is doing too much damage to the healthy tissue surrounding the cancer, then pausing on the chemo might be necessary to prevent additional damage. But without the chemo, the cancer cells can regroup and potentially grow stronger.
Tying back to the interplay between inflation, the Fed, and gold, we can rephrase this environment as “the potential need for more chaos-hedging in our future remains elevated.”
In coming to this conclusion, keep in mind the lag effect of the Fed’s rate hikes and when they’re fully felt in the economy. As we’ve noted here in the Digest, estimates are that it takes roughly six-to-eight months before the full impact of rate hikes are visible.
Translation – there’s a lot more pain in the pipeline headed our way based on what the Fed has been doing over the last, let’s call it 7ish months.
Reminder: September – 75 basis points, November – 75 basis points, December – 50 basis points, February – 25 basis points.
Given all this, it would appear the “soft landing” that some on Wall Street predicted is in danger. But perhaps I’m wrong.
Since roughly 70% of the economy comes from consumer spending, we should ask…
Can the robust U.S. consumer save the day?
“Reports of my death are greatly underestimated” – U.S. Consumer, 2023
In recent months, Wall Street bulls have pointed toward the persistent strength of the U.S. consumer as an indicator that we’re in for a soft landing.
Here in the Digest, we’ve repeatedly questioned this. And Bankrate’s 2023 Annual Emergency Savings Report released a few weeks ago suggests skepticism is warranted.
Here’s the big-picture takeaway from Mark Hamrick, a Bankrate senior economist:
It’s clear that the less-than-optimal economy, including historically high inflation coupled with rising interest rates, has taken a double-edged toll on Americans.
Many have resorted to tapping their emergency savings if they have it, or have taken on credit card debt, or some combination.
Here are some of the survey details:
- More than one-third of survey respondents – 36% – have more credit card debt than emergency savings. This is the highest level on record since 2011.
- More than four in 10 of those in their prime working years (age 27-58) report having more credit card debt than short-term savings.
- Only 43% of U.S. adults would pay for an unexpected emergency expense from savings. And a record-high 25% would have to use credit card debt to pay for a $1,000 emergency expense.
- Nearly seven in 10 respondents (68%) worry they wouldn’t be able to cover their living expenses for just one month if they lost their primary source of income. That figure jumps to 85% for Gen Z’ers.
Keep in mind, this is what’s happening now – when Americans are supposedly still flush with savings thanks to pandemic stimulus dollars.
What sort of economic “landing” do you envision once the stimulus cushion is finally gone?
I suspect “pillowy soft” is not your preferred description.
Before we sign off, keep your eye on this critical S&P level
Regular Digest readers know that we frequently reference an indicator called the 200-day moving average (MA).
To make sure we’re all on the same page, a 200-day moving average is a line on a chart showing the average of the prior 200 days’ worth of asset prices. It’s an important psychological line-in-the-sand for investors and traders.
When the asset’s price is above the 200-day MA, many traders interpret it as a sign that sentiment is bullish. The bearish opposite is true when asset prices are below this level.
Since many trading algorithms base their buy-and-sell decisions on the interplay between an asset’s price and its 200-day moving average, this is an important long-term technical level.
With that context, let’s jump to our March 6 Digest:
…In the wake of January’s market strength, the S&P pushed above its 200-day MA.
While that was a sign of strength, the big question became “would it hold?”
After all, it’s one thing to breach the 200-day MA, it’s another to turn this level – which was formerly resistance – into new support.
Well, two weeks ago, the S&P did, in fact, bounce off this 200-day MA, turning it into support.
Here was our take:
Credit where credit is due…
The S&P held a critical technical level last week, and it’s a big win for bulls.
But the title of that Digest was “The Bulls Got This Right…at Least for Now.”
Well, as the banking sector has imploded, the “for now” part has kicked in.
Over the last week, the S&P lost the support of its 200-day MA, but is now trying to rally, retake, and hold it.
While the S&P was able to pop its head above this line yesterday, we’re slipping below it again as I write Friday.
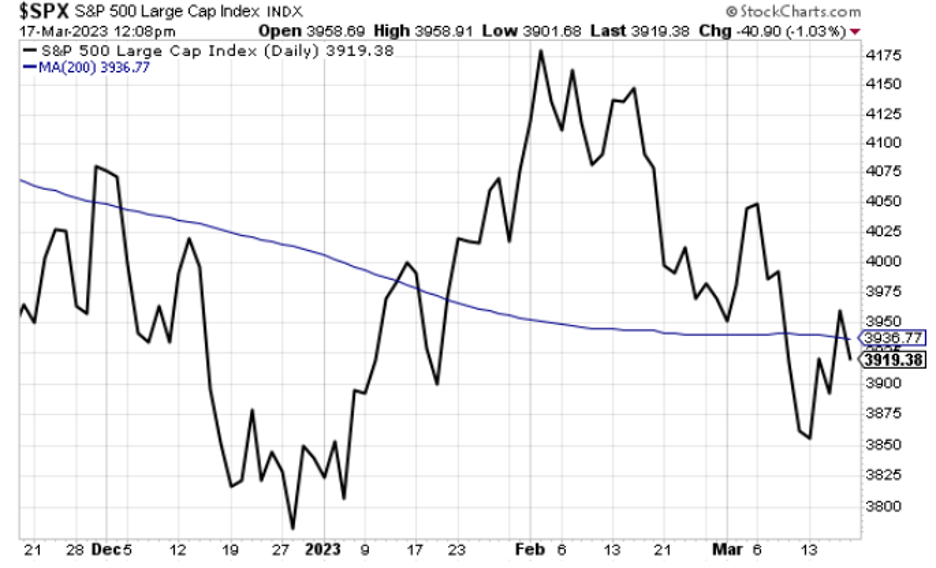 Source: StockCharts.com
If you’re looking for clues about the market’s short-term direction, focus here.
If the S&P can push materially higher than this 200-day MA then use it for support, the odds increase we’ll see a bigger bounce. But if the market hits its head on this 200-day MA and falls back, watch out for accelerating market weakness.
In any case, the bigger issue for stocks is a Fed that’s now hamstrung by its own doing.
Damn those pesky consequences of our own actions!
Have a good evening,
Jeff Remsburg
The post Gold Pops on Market Chaos appeared first on InvestorPlace.
gold inflation monetary policy interest rates fed monetary policy


Canadian Silver Co. Will See Big Changes in 2024
Source: Michael Ballanger 12/22/2023
Michael Ballanger of GGM Advisory Inc. takes a look at the current state of the market and shares on stock…
EGR options out Urban Berry project in Quebec to Harvest Gold – Richard Mills
2023.12.23
EGR Exploration Ltd. (TSXV: EGR) has moved from owner to shareholder at its Urban Berry project in Quebec, this week announcing it is optioning…
Crypto, Crude, & Crap Stocks Rally As Yield Curve Steepens, Rate-Cut Hopes Soar
Crypto, Crude, & Crap Stocks Rally As Yield Curve Steepens, Rate-Cut Hopes Soar
A weird week of macro data – strong jobless claims but…


