Precious Metals
How to Play Growing Market Strength
The S&P is flashing green … another bullish indicator on the verge of triggering … bullish indicators over in gold … checking in on our home-builders…

The S&P is flashing green … another bullish indicator on the verge of triggering … bullish indicators over in gold … checking in on our home-builders trade
The market is selling off a bit as I write Monday early-afternoon, but if we pull back and look at the entire month, we see growing strength.
Several technical indicators have either just flashed green or are currently flirting with a change to green.
Let’s begin with the one that happened earlier this January.
Here’s our hypergrowth expert Luke Lango to set the stage:
Earlier this month, the stock market triggered what is known as a “Golden Cross” signal. And whenever this particular Golden Cross signal has been triggered over the past 15 years, stocks proceeded to boom.
A Golden Cross signal is triggered when the market’s short-term moving average flips above its long-term moving average.
It is a bullish sign that short-term price momentum is meaningfully improving relative to the long-term price trend.
In fact, many investors believe the Golden Cross signal is the most powerful technical indicator in the market.
Luke explains how, in early January, the S&P’s 50-day moving average (MA) pushed north through its 150-day moving average.
This was the first time during this bear market that this MA inversion has occurred.
Back to Luke on the implications:
Over the past 15 years, whenever the S&P 500 triggered this signal for the first time in a market selloff, the selloff abruptly ended. And stocks proceeded to soar!
For example, the last time this Golden Cross signal flashed was in summer 2020 – just as stocks were starting to soar out of the COVID-19 lockdowns.
Before that, it flashed in early 2019, when the market was making a huge comeback from a nasty late 2018 plunge.
And before that, it flashed in early 2016 – just as stocks were starting to get their groove back following a year of going basically nowhere.
Last week, the S&P’s bullishness triggered another key technical indicator
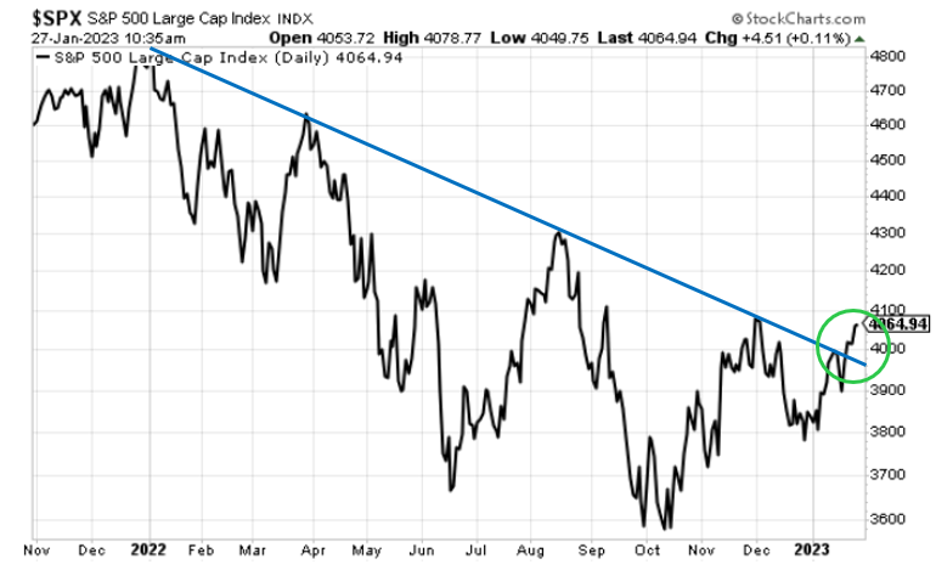
As we noted in Friday’s Digest, the S&P finally broke its long-term down-sloping trendline.
This is something the S&P failed to do throughout the entirety of 2022. This is a significant display of strength and shows swelling momentum behind the bulls.
 Source: StockCharts.com
Now, the key issue here is whether the S&P can change this line from resistance into support.
We want to see some short-term weakness that brings the S&P back to the trendline, followed by a swell of buying pressure that pushes prices north again.
In essence, we want to see this resistance line become a launch pad.
This week presents an opportunity for this dynamic to play out. We might be seeing the beginning of this pullback today as I write.
Another potential bullish technical indicator
A moment ago, Luke explained the importance of a Golden Cross in the S&P with its 50-day MA and its 150-day MA.
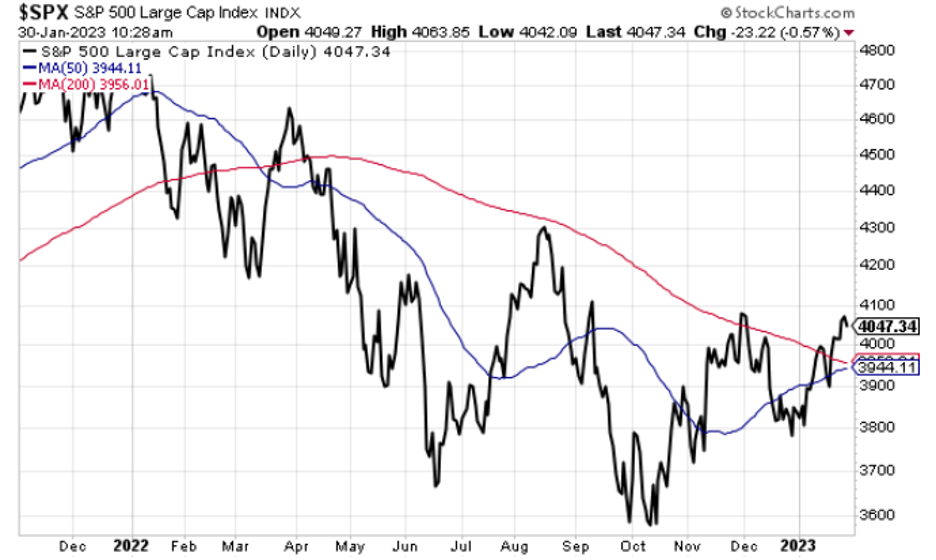
Well, we’re on the verge of another Golden Cross that I would argue is more significant – the 50-day MA crossing above the 200-day MA.
As you can see below, the S&P’s 50-day MA (in blue) is about to push north through its 200-day MA (in red). This is a more widely recognized technical indicator for evaluating long-term trend direction.
 Source: StockCharts.com
To get a sense of how well this cross can mark long-term trend changes, look at the chart again, specifically, back in mid-March of last year.
You’ll see at that time, the blue 50-day MA was falling beneath the red 200-day MA. This is what’s called a “Death Cross.”
In our March 16, 2022, Digest, we warned readers about the potential fallout from this Death Cross
From that Digest:
…Over the last 10 years, every time the 50-day SMA has fallen through the 200-day SMA, the S&P has seen a substantial pullback.
The exception is the 2020 bear market, which happened so fast (while the recovery was equally fast) that these moving averages didn’t cross until the stock market damage was already in the rearview mirror.
Well, we’ve now officially had that death cross…
Though this doesn’t guarantee that the stock market is headed lower, this is certainly not a good sign. And it suggests investors need to be especially careful about throwing money into the average S&P 500 stock today.
Had an investor sold out of the S&P at this Death Cross, he/she would have avoided the approximately 15% drawdown that ensued.
But in the same way that a Death Cross is a bearish signal for the S&P, a Golden Cross is a bullish signal.
We can argue about whether fundamentals support this bullishness, but the bottom line is that stocks are gathering momentum today.
Speaking of technical strength and bullish breakouts, keep your eyes on gold
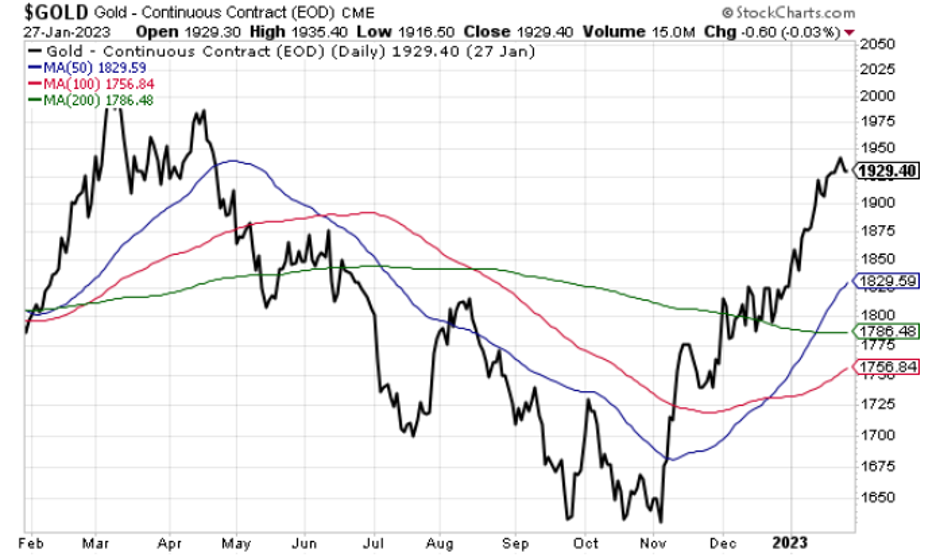
The yellow metal has exploded out of its November low.
As I write, it’s up roughly 18% since early-November.
This bullish jag north has resulted in two Golden Crosses, with the 50-day MA (in blue) piercing both the 100-day MA (in red) and the 200-day MA (in green).
Take a look.
 Source: StockCharts.com
As we’ve done in the Digest for months now, we urge readers to have at least some exposure to gold. We think 2023 will mark a new all-time-high.
That said, we careful in the near-term.
As I write, gold’s Relative Strength Index (RSI) reading has just fallen from “oversold” conditions and is dropping. That often precedes a decline in the asset’s market price.
It wouldn’t be surprising to see gold sell off after the monster run its enjoyed since November.
So, our outlook calls for short-term weakness followed by return to bullishness then all-time-highs.
Finally, our aggressive ITB trade from back in the spring is paying off and showing its own technical strength
In our April 20, 2022, Digest, we suggested that aggressive investors could jump into an iShares Home Construction ETF (ITB) trade.
That call was due to the potential for major, multi-year gains we see coming after the market bottomed from recent basement prices.
Here was our disclaimer from that Digest about our timing and the potential for further volatility:
If you’re an aggressive trader who doesn’t mind the possibility of being early and sitting through some sideways (or even down) action, this is a reasonable entry point.
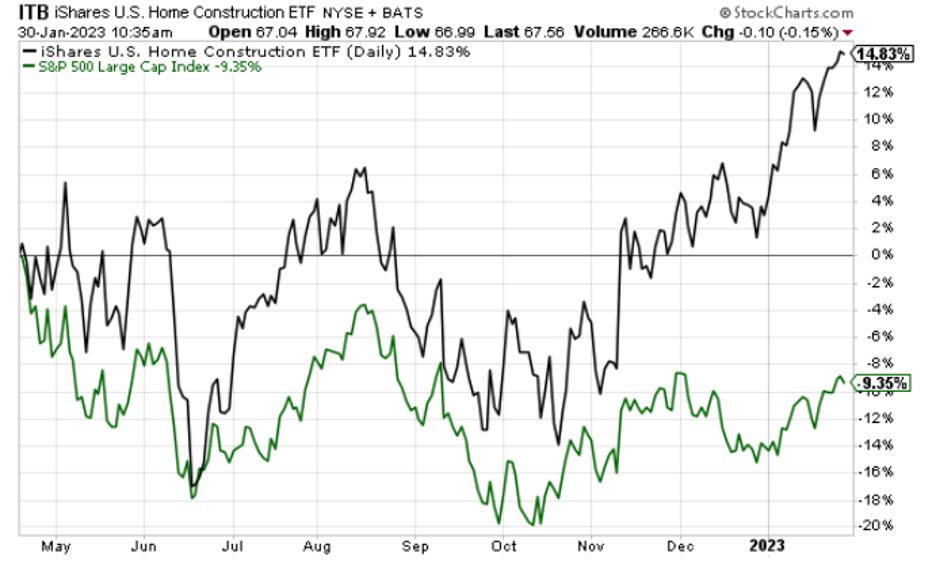
Reviewing this trade now, it was indeed a reasonable entry point.
Below, you can see ITB falling further after our April Digest, but then rallying hard. An aggressive trader who took this ITB position would be 15% right now, crushing the S&P which is down 9% over the same period.
 Source: StockCharts.com
Even better, let’s now look at ITB’s technical chart.
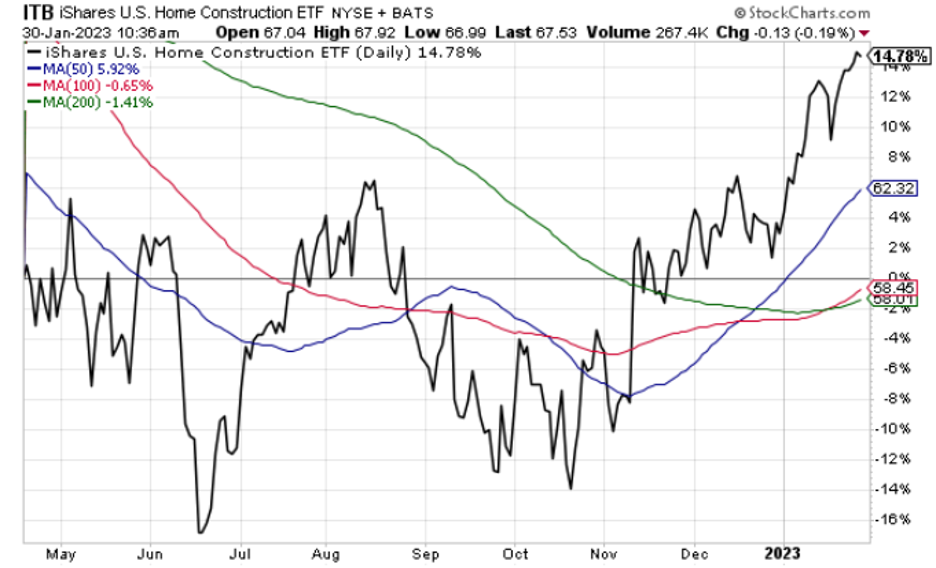 Source: StockCharts.com
All of the major MAs are sloping higher.
Plus, we recently saw a Golden Cross with the 100-day MA pushing through the 200-day MA. Again, this is massively bullish.
Now, while we think this trade has far higher to go, similar to gold, keep an eye on ITB’s RSI level. Though not yet officially “overbought” today, we’re nearly there.
The official overbought level is “70” and ITB’s RSI clocks in at 68 as I write Monday.
So, there could be a breather in store for this home construction trade, but behind it, major strength remains.
Put it all together, and we’re seeing growing strength across many different assets and sectors today
We won’t go so far as giving an “all clear” for the market. Regular Digest readers know that we have our concerns about a final earnings-based drawdown in the coming months.
But our job is to be objective about what’s happening in the market, and what the data are showing us. And today, a growing volume of that data is looking green.
We’ll continue monitoring all this for you here in the Digest.
Have a good evening,
Jeff Remsburg
The post How to Play Growing Market Strength appeared first on InvestorPlace.


Canadian Silver Co. Will See Big Changes in 2024
Source: Michael Ballanger 12/22/2023
Michael Ballanger of GGM Advisory Inc. takes a look at the current state of the market and shares on stock…
EGR options out Urban Berry project in Quebec to Harvest Gold – Richard Mills
2023.12.23
EGR Exploration Ltd. (TSXV: EGR) has moved from owner to shareholder at its Urban Berry project in Quebec, this week announcing it is optioning…
Crypto, Crude, & Crap Stocks Rally As Yield Curve Steepens, Rate-Cut Hopes Soar
Crypto, Crude, & Crap Stocks Rally As Yield Curve Steepens, Rate-Cut Hopes Soar
A weird week of macro data – strong jobless claims but…


