Companies
Are Professional Investors Waking Up these Record Silver Deficits?
In 2022 the silver market posted what may well have been the largest deficit on record. These are set to … Read More
The post Gold Digger: Are professional…
- Sizable silver deficits (physical demand greater than supply) set to continue in 2023, and beyond
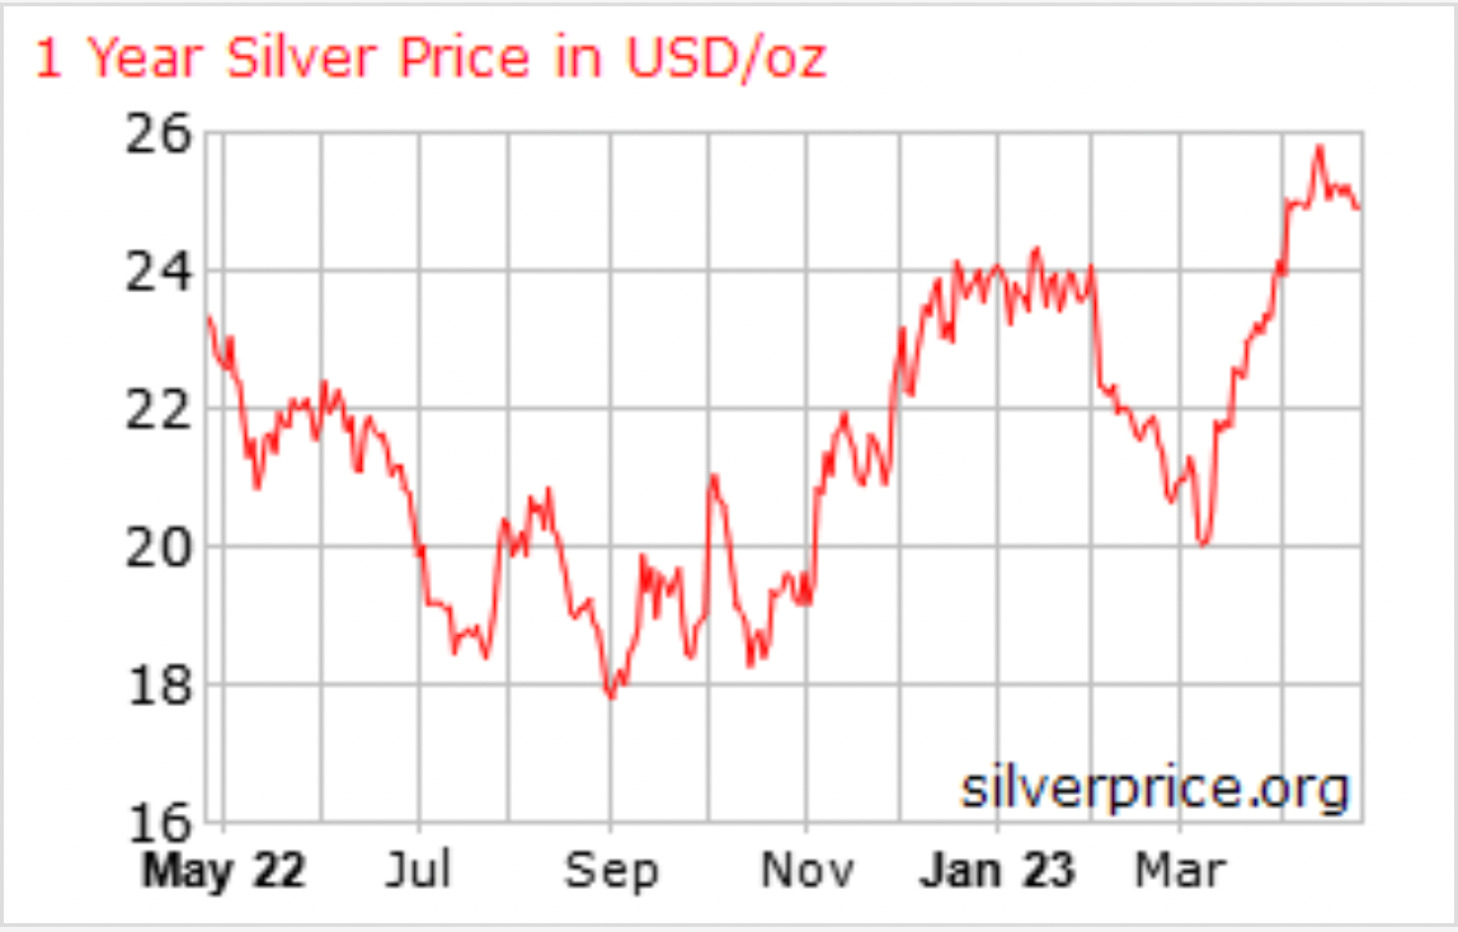
- Investor activity which has now pushed the silver price to a 30% gain over the past 6 months
- Small Cap Quarterly Wrap: Besra, West Wits, Classic
Our Gold Digger column wraps all the news driving ASX stocks with exposure to precious metals.
As a precious metals bull, silver’s record-breaking performance in 2022 makes for great reading.
Demand rose by 18% to a new high of 1242Moz.
Meanwhile, limited organic growth, project delays and disruptions resulted in a 0.6% fall in mine production in 2022.
This led to the silver market posting what may well have been the largest deficit on record.
In fact, the deficits in 2021 and 2022 more than offset the cumulative surpluses of the previous 11 years.
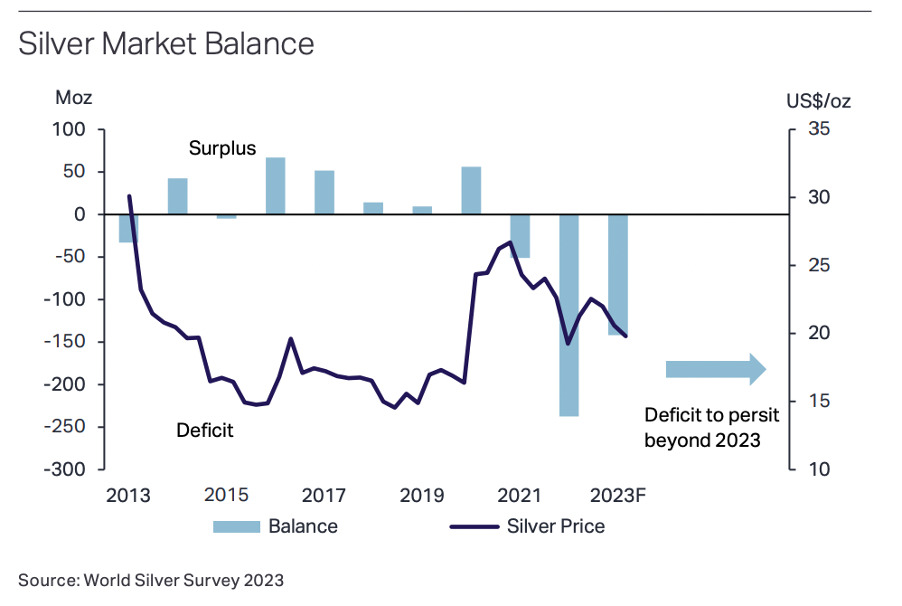
Another sizable +100Moz deficit is expected in 2023, and beyond.
Why? It’s hard to ‘turn on’ substantial additional silver supply, which is often mined alongside other metals.
Last year’s decline was driven by by-product output from lead/zinc mines (-3.5%), particularly in China and Peru.
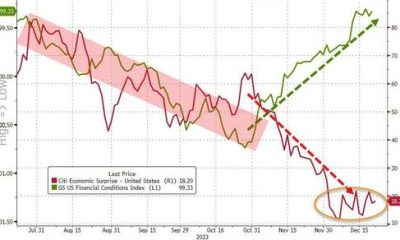
Perhaps it’s partially this massive (and ongoing) demand-supply imbalance, alongside appetite for risk hedges, which has prompted investors to pour back into the metal in 2023.
Professional investors hold the key to silver’s rise
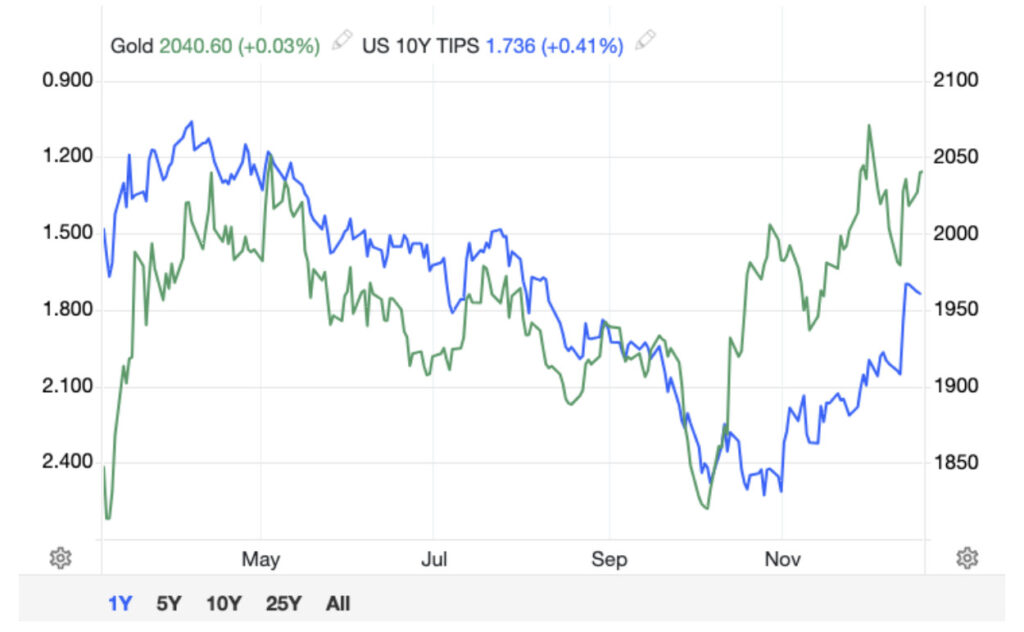
Silver has a unique dual function, as an industrial metal and investor safe haven/risk hedge.
Prices rarely take their cue from the former (fundamentals like demand and supply) and are instead largely driven by the latter (professional investor activity).
It is that investor activity which has now pushed the silver price to a 30% gain over the past six months.
But Metals Focus believes this can’t last, for one reason: The Fed won’t cut rates in the back end of 2023.
“In spite of the recent boom in investor demand and the price rally, we believe that institutional investment will lose momentum later this year,” it says.
“This reflects our view that the current market consensus, that the Fed will be forced to cut rates in H2.23, will be proven wrong.
“A likely equity market correction, as a result of weaker corporate earnings, could also trigger an investor sell-off across assets, which will inevitably affect silver (as well as gold).
“All these factors should see the silver price eventually suffer from investor liquidations in the second half of the year, driving prices lower.”
Silver’s fate in the Fed’s hands
Unlike Metals Focus, Morningstar expects the Fed to pause its rate hikes by summer 2023, then start cutting around the end of 2023.
It admits interest rates have risen much further than most forecasters (including them) anticipated, with the US economy proving more resilient to the impact of higher rates than expected.
“We think that households’ excess savings and other factors are temporarily cushioning the hit from higher interest rates,” it says.
“In 2023, we expect the impact of rate hikes to be felt more strongly in other parts of the US economy.
“We project a year-end 2023 federal funds rate of 4.75%, falling to about 2.00% by the end of 2024.”
Winners & Losers
Here’s how ASX-listed precious metals stocks are performing:
Scroll or swipe to reveal table. Click headings to sort. Best viewed on a laptop.
Stocks missing from this list? Email [email protected]
| Code | Company | % Friday | % Week | % Month | % YTD | % 12 month | Price | Market Cap |
|---|---|---|---|---|---|---|---|---|
| NES | Nelson Resources. | 25% | 0% | -17% | -29% | -71% | 0.005 | $2,354,377 |
| BAT | Battery Minerals Ltd | 14% | 0% | 14% | 0% | -56% | 0.004 | $11,749,298 |
| SBR | Sabre Resources | 14% | 0% | -11% | -34% | -55% | 0.025 | $6,412,696 |
| TSO | Tesoro Gold Ltd | 13% | 45% | 55% | 25% | -41% | 0.045 | $42,140,503 |
| PUR | Pursuit Minerals | 13% | -5% | -5% | 13% | -38% | 0.018 | $41,380,764 |
| PKO | Peako Limited | 11% | 25% | 11% | -31% | -44% | 0.01 | $4,236,583 |
| ENR | Encounter Resources | 10% | 10% | 39% | -11% | 0% | 0.16 | $51,551,238 |
| OKR | Okapi Resources | 8% | 8% | 0% | -10% | -56% | 0.135 | $22,948,227 |
| ADV | Ardiden Ltd | 8% | 0% | 0% | 0% | -48% | 0.007 | $17,474,180 |
| MI6 | Minerals260Limited | 8% | -6% | 37% | 25% | -8% | 0.425 | $92,430,000 |
| ASO | Aston Minerals Ltd | 8% | 0% | -5% | 25% | -31% | 0.1 | $103,669,977 |
| TG1 | Techgen Metals Ltd | 8% | 12% | 41% | 5% | -34% | 0.086 | $5,144,891 |
| ARV | Artemis Resources | 7% | -6% | 7% | -36% | -74% | 0.016 | $23,421,276 |
| BTR | Brightstar Resources | 7% | 14% | 0% | -6% | -43% | 0.016 | $12,489,432 |
| GSM | Golden State Mining | 6% | -6% | 14% | -23% | -57% | 0.033 | $3,627,440 |
| CDT | Castle Minerals | 6% | 6% | -6% | -19% | -67% | 0.017 | $17,991,888 |
| TAM | Tanami Gold NL | 6% | 3% | 6% | -5% | -38% | 0.037 | $41,128,397 |
| FG1 | Flynngold | 6% | 7% | -6% | -24% | -47% | 0.076 | $7,406,895 |
| GSR | Greenstone Resources | 6% | 6% | -14% | -41% | -41% | 0.019 | $21,838,831 |
| VRC | Volt Resources Ltd | 5% | 5% | 5% | -30% | -52% | 0.0105 | $39,394,239 |
| M24 | Mamba Exploration | 5% | -13% | 42% | -28% | -19% | 0.105 | $6,098,334 |
| GWR | GWR Group Ltd | 5% | 5% | -11% | 44% | -47% | 0.085 | $26,018,549 |
| RSG | Resolute Mining | 5% | 6% | 27% | 141% | 68% | 0.4825 | $979,343,022 |
| BGD | Bartongoldholdings | 5% | 0% | 0% | 15% | 0% | 0.23 | $18,993,281 |
| MEI | Meteoric Resources | 4% | 27% | 27% | 235% | 1083% | 0.1775 | $295,552,154 |
| EM2 | Eagle Mountain | 4% | -25% | -31% | -29% | -66% | 0.12 | $35,071,189 |
| SPD | Southernpalladium | 4% | 4% | -11% | -36% | 0% | 0.52 | $21,539,164 |
| PRS | Prospech Limited | 4% | -23% | 17% | 1% | -48% | 0.027 | $2,640,128 |
| EMR | Emerald Res NL | 4% | 2% | 26% | 58% | 61% | 1.87 | $1,071,810,774 |
| CAZ | Cazaly Resources | 4% | 16% | 12% | -15% | -24% | 0.029 | $10,411,010 |
| ALY | Alchemy Resource Ltd | 3% | 0% | 7% | -35% | -56% | 0.015 | $17,082,106 |
| LCL | Los Cerros Limited | 3% | 18% | 3% | -42% | -63% | 0.033 | $25,417,743 |
| SVG | Savannah Goldfields | 3% | 6% | 9% | -8% | -13% | 0.175 | $32,104,234 |
| MTC | Metalstech Ltd | 3% | 25% | -1% | -32% | 48% | 0.355 | $61,221,834 |
| MLS | Metals Australia | 3% | -5% | 3% | -19% | -78% | 0.036 | $21,246,267 |
| NAG | Nagambie Resources | 3% | -19% | -15% | -41% | -19% | 0.039 | $22,105,600 |
| SPQ | Superior Resources | 3% | -7% | -23% | -29% | -2% | 0.04 | $66,347,596 |
| HMX | Hammer Metals Ltd | 2% | 0% | 60% | 22% | -17% | 0.083 | $66,533,995 |
| MKR | Manuka Resources. | 2% | 10% | 16% | 2% | -69% | 0.087 | $45,973,955 |
| NSM | Northstaw | 2% | -2% | -18% | -21% | -58% | 0.1225 | $14,415,240 |
| GCY | Gascoyne Res Ltd | 2% | 2% | 28% | -24% | -45% | 0.1275 | $109,626,638 |
| FEG | Far East Gold | 2% | -3% | -3% | -40% | -24% | 0.29 | $43,618,740 |
| ICL | Iceni Gold | 2% | -3% | -26% | -23% | -61% | 0.062 | $12,722,857 |
| DRE | Dreadnought Resources Ltd | 2% | -9% | 5% | -40% | 50% | 0.063 | $205,389,150 |
| BCN | Beacon Minerals | 2% | 0% | 10% | 18% | -3% | 0.033 | $122,094,966 |
| ANX | Anax Metals Ltd | 1% | -3% | 15% | 30% | -37% | 0.069 | $27,838,848 |
| PGD | Peregrine Gold | 1% | 1% | -3% | -1% | -22% | 0.38 | $21,038,479 |
| AAJ | Aruma Resources Ltd | 1% | 1% | 35% | 45% | -21% | 0.077 | $11,929,074 |
| NCM | Newcrest Mining | 1% | 0% | 9% | 40% | 7% | 28.88 | $25,494,518,169 |
| DCN | Dacian Gold Ltd | 1% | -1% | 4% | -17% | -64% | 0.083 | $99,777,677 |
| IGO | IGO Limited | 1% | -2% | 14% | 1% | 5% | 13.64 | $10,207,970,119 |
| GBR | Greatbould Resources | 1% | -6% | -4% | 0% | -9% | 0.09 | $43,168,701 |
| CWX | Carawine Resources | 1% | 3% | 0% | -2% | -53% | 0.098 | $19,091,294 |
| CHN | Chalice Mining Ltd | 1% | 1% | 26% | 26% | 23% | 7.92 | $2,951,346,001 |
| TUL | Tulla Resources | 1% | 0% | 28% | -4% | -47% | 0.32 | $102,172,771 |
| GMD | Genesis Minerals | 1% | 0% | 30% | 9% | -4% | 1.365 | $644,448,719 |
| SMI | Santana Minerals Ltd | 1% | -7% | 3% | 14% | -2% | 0.745 | $110,095,423 |
| SLR | Silver Lake Resource | 0% | 4% | 14% | 7% | -36% | 1.2725 | $1,180,775,303 |
| MRR | Minrex Resources Ltd | 0% | 0% | -30% | -50% | -76% | 0.016 | $17,357,880 |
| NPM | Newpeak Metals | 0% | 0% | 0% | 0% | 0% | 0.001 | $9,145,132 |
| FFX | Firefinch Ltd | 0% | 0% | 0% | 0% | -42% | 0.2 | $236,569,315 |
| GED | Golden Deeps | 0% | 0% | -6% | -17% | -53% | 0.0075 | $8,664,200 |
| G88 | Golden Mile Res Ltd | 0% | 10% | 47% | 8% | -66% | 0.022 | $5,795,509 |
| DCX | Discovex Res Ltd | 0% | 0% | 0% | 0% | -61% | 0.003 | $9,907,704 |
| NMR | Native Mineral Res | 0% | 0% | -20% | -64% | -80% | 0.04 | $4,805,549 |
| AQX | Alice Queen Ltd | 0% | 50% | 0% | -25% | -81% | 0.0015 | $3,795,431 |
| MKG | Mako Gold | 0% | -3% | -5% | -5% | -54% | 0.038 | $17,922,752 |
| KSN | Kingston Resources | 0% | -9% | 12% | 30% | -38% | 0.105 | $43,643,634 |
| AMI | Aurelia Metals Ltd | 0% | -16% | 29% | 8% | -69% | 0.135 | $167,054,024 |
| PNX | PNX Metals Limited | 0% | 0% | 20% | -29% | -36% | 0.003 | $16,141,874 |
| GIB | Gibb River Diamonds | 0% | -4% | 10% | -25% | -27% | 0.045 | $9,517,925 |
| TMX | Terrain Minerals | 0% | -8% | 20% | 0% | -43% | 0.006 | $6,499,196 |
| BNR | Bulletin Res Ltd | 0% | -4% | -6% | -9% | -60% | 0.085 | $24,955,244 |
| SKY | SKY Metals Ltd | 0% | -13% | 6% | 8% | -47% | 0.052 | $19,592,740 |
| CST | Castile Resources | 0% | -3% | -4% | 1% | -40% | 0.096 | $23,222,633 |
| YRL | Yandal Resources | 0% | 1% | 1% | -11% | -65% | 0.087 | $13,728,868 |
| ARL | Ardea Resources Ltd | 0% | -2% | -18% | -44% | -74% | 0.4 | $68,601,109 |
| GTR | Gti Energy Ltd | 0% | -6% | 6% | -21% | -57% | 0.0085 | $15,236,110 |
| IPT | Impact Minerals | 0% | 8% | 30% | 86% | 3% | 0.013 | $32,257,817 |
| MOH | Moho Resources | 0% | -26% | 11% | -5% | -61% | 0.02 | $4,153,244 |
| PUA | Peak Minerals Ltd | 0% | -20% | 0% | -33% | -75% | 0.004 | $4,165,506 |
| SMS | Starmineralslimited | 0% | -4% | -3% | -3% | -65% | 0.07 | $2,109,926 |
| MVL | Marvel Gold Limited | 0% | -12% | -12% | -42% | -67% | 0.015 | $10,576,416 |
| PRX | Prodigy Gold NL | 0% | 0% | 22% | -8% | -46% | 0.011 | $19,226,711 |
| AAU | Antilles Gold Ltd | 0% | -5% | -5% | 17% | -46% | 0.035 | $17,160,879 |
| RND | Rand Mining Ltd | 0% | 2% | -3% | -1% | -13% | 1.35 | $76,782,547 |
| REZ | Resourc & En Grp Ltd | 0% | 14% | 7% | 0% | -64% | 0.016 | $7,996,893 |
| GMR | Golden Rim Resources | 0% | 3% | 10% | 10% | -50% | 0.034 | $20,114,005 |
| KAL | Kalgoorliegoldmining | 0% | -5% | -20% | -52% | -71% | 0.04 | $3,100,841 |
| SIH | Sihayo Gold Limited | 0% | 0% | 0% | 0% | -33% | 0.002 | $12,204,256 |
| WA8 | Warriedarresourltd | 0% | 8% | -3% | -18% | 8% | 0.14 | $60,348,234 |
| WCN | White Cliff Min Ltd | 0% | -11% | -11% | -43% | -72% | 0.008 | $7,672,435 |
| AVM | Advance Metals Ltd | 0% | -10% | 13% | -10% | -44% | 0.009 | $5,238,397 |
| WRM | White Rock Min Ltd | 0% | 0% | 0% | -5% | -69% | 0.063 | $17,508,200 |
| ASR | Asra Minerals Ltd | 0% | -5% | -14% | -53% | -65% | 0.0095 | $13,937,627 |
| AME | Alto Metals Limited | 0% | -7% | -5% | -6% | -32% | 0.063 | $38,607,375 |
| CTO | Citigold Corp Ltd | 0% | 0% | 0% | -17% | -41% | 0.005 | $14,368,295 |
| TIE | Tietto Minerals | 0% | -6% | -2% | -16% | 23% | 0.595 | $647,078,857 |
| M2R | Miramar | 0% | 2% | 5% | -44% | -77% | 0.045 | $3,515,478 |
| MHC | Manhattan Corp Ltd | 0% | 0% | 0% | -9% | -62% | 0.005 | $14,681,393 |
| GRL | Godolphin Resources | 0% | -7% | -11% | -8% | -46% | 0.076 | $8,996,078 |
| TRY | Troy Resources Ltd | 0% | 0% | 0% | 0% | 0% | 0.0295 | $62,920,961 |
| CGN | Crater Gold Min Ltd | 0% | 0% | 0% | 0% | 0% | 0.014499 | $17,965,037 |
| EMC | Everest Metals Corp | 0% | -14% | 7% | -4% | -46% | 0.076 | $9,836,916 |
| GUL | Gullewa Limited | 0% | 0% | -2% | -8% | -32% | 0.055 | $10,767,521 |
| G50 | Gold50Limited | 0% | -3% | -7% | -22% | -17% | 0.195 | $11,103,885 |
| VKA | Viking Mines Ltd | 0% | 9% | 0% | 20% | 0% | 0.012 | $12,303,101 |
| MTH | Mithril Resources | 0% | 0% | 0% | -43% | -78% | 0.002 | $6,526,180 |
| ADG | Adelong Gold Limited | 0% | 8% | 18% | 86% | -63% | 0.013 | $6,939,690 |
| XTC | Xantippe Res Ltd | 0% | -25% | -33% | -40% | -79% | 0.003 | $31,740,299 |
| MZZ | Matador Mining Ltd | 0% | 3% | -11% | -36% | -69% | 0.074 | $23,326,194 |
| KZR | Kalamazoo Resources | 0% | -15% | 0% | -33% | -66% | 0.14 | $21,152,679 |
| MAU | Magnetic Resources | 0% | 4% | -26% | -40% | -64% | 0.515 | $118,198,876 |
| BYH | Bryah Resources Ltd | 0% | 0% | 15% | -12% | -62% | 0.023 | $6,468,830 |
| MEU | Marmota Limited | 0% | -3% | -8% | -27% | -29% | 0.035 | $37,058,020 |
| AL8 | Alderan Resource Ltd | 0% | 0% | 0% | 14% | -67% | 0.008 | $4,859,271 |
| GMN | Gold Mountain Ltd | 0% | 0% | -25% | -57% | -57% | 0.003 | $5,909,798 |
| MEG | Megado Minerals Ltd | 0% | -14% | 13% | -2% | -71% | 0.044 | $8,934,445 |
| HMG | Hamelingoldlimited | 0% | 10% | 21% | -24% | -29% | 0.11 | $12,100,000 |
| TBA | Tombola Gold Ltd | 0% | 0% | 0% | 0% | -51% | 0.026 | $33,129,243 |
| BM8 | Battery Age Minerals | 0% | -7% | -6% | -33% | -33% | 0.335 | $24,863,085 |
| HRN | Horizon Gold Ltd | 0% | -8% | 0% | 13% | -15% | 0.35 | $43,813,574 |
| CLA | Celsius Resource Ltd | 0% | 7% | 7% | 0% | -30% | 0.016 | $29,963,493 |
| QML | Qmines Limited | 0% | 3% | -9% | -9% | -46% | 0.15 | $13,531,355 |
| RDN | Raiden Resources Ltd | 0% | 0% | 5% | -16% | -74% | 0.004 | $7,418,330 |
| TCG | Turaco Gold Limited | 0% | -5% | -6% | 5% | -39% | 0.061 | $26,090,717 |
| DTM | Dart Mining NL | 0% | -17% | 15% | 9% | -18% | 0.06 | $9,337,234 |
| AUC | Ausgold Limited | 0% | -6% | 0% | 6% | -32% | 0.05 | $113,139,962 |
| EMU | EMU NL | 0% | -20% | 0% | -59% | -85% | 0.002 | $2,900,043 |
| SFM | Santa Fe Minerals | 0% | -8% | -5% | -31% | -54% | 0.055 | $4,005,033 |
| X64 | Ten Sixty Four Ltd | 0% | 0% | 0% | -11% | -32% | 0.57 | $130,184,182 |
| SI6 | SI6 Metals Limited | 0% | 0% | -17% | -17% | -50% | 0.005 | $7,476,973 |
| HAW | Hawthorn Resources | 0% | 0% | 2% | -26% | -47% | 0.085 | $28,476,327 |
| AGC | AGC Ltd | 0% | -2% | -7% | -15% | -49% | 0.051 | $5,100,000 |
| RVR | Red River Resources | 0% | 0% | 0% | 0% | -69% | 0.073 | $37,847,908 |
| RGL | Riversgold | 0% | -6% | -12% | -50% | -78% | 0.015 | $14,182,016 |
| CPM | Coopermetalslimited | 0% | -5% | 26% | 48% | -19% | 0.3475 | $14,339,813 |
| TMZ | Thomson Res Ltd | 0% | 0% | 0% | -74% | -88% | 0.005 | $4,349,755 |
| WMC | Wiluna Mining Corp | 0% | 0% | 0% | 0% | -68% | 0.205 | $74,238,031 |
| BMO | Bastion Minerals | 0% | 0% | -7% | -26% | -87% | 0.025 | $3,985,290 |
| IDA | Indiana Resources | 0% | -18% | -20% | -27% | -41% | 0.04 | $20,148,193 |
| GSN | Great Southern | 0% | 5% | 10% | -21% | -60% | 0.023 | $15,260,661 |
| RED | Red 5 Limited | 0% | 0% | 14% | -22% | -59% | 0.16 | $553,517,341 |
| THR | Thor Energy PLC | 0% | 0% | 11% | -17% | -67% | 0.005 | $7,380,564 |
| CDR | Codrus Minerals Ltd | 0% | 14% | 34% | -4% | 37% | 0.125 | $5,053,750 |
| MDI | Middle Island Res | 0% | 26% | 23% | 13% | -69% | 0.043 | $5,263,984 |
| KAI | Kairos Minerals Ltd | 0% | -4% | 16% | -4% | -24% | 0.022 | $43,210,057 |
| CXU | Cauldron Energy Ltd | 0% | 0% | -13% | 0% | -52% | 0.007 | $6,520,981 |
| HXG | Hexagon Energy | 0% | 0% | 0% | -35% | -69% | 0.011 | $5,642,075 |
| AVW | Avira Resources Ltd | 0% | 0% | 0% | 0% | -50% | 0.003 | $6,401,370 |
| MAT | Matsa Resources | 0% | -2% | 14% | 14% | -33% | 0.042 | $17,304,194 |
| ZAG | Zuleika Gold Ltd | 0% | 0% | 8% | -33% | -53% | 0.014 | $7,322,709 |
| GML | Gateway Mining | 0% | -4% | 20% | -20% | -60% | 0.048 | $12,784,010 |
| SAU | Southern Gold | 0% | 0% | -9% | -16% | -57% | 0.021 | $6,305,991 |
| CEL | Challenger Exp Ltd | 0% | -9% | 12% | -17% | -55% | 0.145 | $160,464,014 |
| OZM | Ozaurum Resources | 0% | -8% | 38% | -12% | -60% | 0.058 | $7,366,000 |
| KTA | Krakatoa Resources | 0% | 6% | 14% | -25% | -73% | 0.033 | $11,375,427 |
| ARN | Aldoro Resources | 0% | -3% | -18% | 3% | -40% | 0.165 | $22,179,918 |
| MBK | Metal Bank Ltd | 0% | 3% | 10% | -6% | -47% | 0.032 | $8,847,537 |
| A8G | Australasian Metals | 0% | -3% | -9% | -18% | -67% | 0.155 | $6,381,427 |
| DTR | Dateline Resources | 0% | -5% | 0% | -51% | -87% | 0.018 | $11,588,752 |
| S2R | S2 Resources | 0% | 0% | 0% | -18% | -10% | 0.14 | $57,412,813 |
| TLM | Talisman Mining | 0% | -3% | 4% | 0% | -18% | 0.14 | $26,283,530 |
| ICG | Inca Minerals Ltd | 0% | -6% | -11% | -26% | -83% | 0.017 | $8,219,746 |
| A1G | African Gold Ltd. | 0% | 8% | 19% | -4% | -37% | 0.08 | $13,544,897 |
| OAU | Ora Gold Limited | 0% | -17% | 0% | -50% | -75% | 0.0025 | $9,842,313 |
| GNM | Great Northern | 0% | -33% | -43% | -50% | -64% | 0.002 | $3,418,102 |
| TRM | Truscott Mining Corp | 0% | -13% | -13% | 0% | -20% | 0.041 | $6,853,439 |
| DEX | Duke Exploration | 0% | 0% | 0% | 0% | -65% | 0.053 | $5,587,240 |
| AWJ | Auric Mining | 0% | 4% | 17% | -19% | -40% | 0.052 | $6,804,699 |
| AZS | Azure Minerals | 0% | -11% | 22% | 71% | 17% | 0.385 | $150,240,888 |
| AYM | Australia United Min | 0% | 0% | 0% | 0% | -50% | 0.003 | $5,527,732 |
| BRB | Breaker Res NL | 0% | -3% | 15% | 45% | 79% | 0.465 | $153,640,110 |
| ANL | Amani Gold Ltd | 0% | 0% | 0% | 0% | -33% | 0.001 | $25,143,441 |
| PGO | Pacgold | 0% | 2% | 16% | 19% | -39% | 0.43 | $23,633,580 |
| KIN | KIN Min NL | 0% | -5% | -9% | -40% | -57% | 0.039 | $45,947,871 |
| CLZ | Classic Min Ltd | 0% | 0% | -33% | -89% | -99% | 0.001 | $5,426,262 |
| TGM | Theta Gold Mines Ltd | 0% | 0% | 43% | 18% | -41% | 0.08 | $49,852,154 |
| ORN | Orion Minerals Ltd | 0% | 7% | 33% | 0% | -36% | 0.016 | $87,452,173 |
| TMB | Tambourahmetals | 0% | 4% | 38% | 14% | -53% | 0.12 | $4,943,112 |
| TMS | Tennant Minerals Ltd | 0% | -9% | 7% | 0% | -35% | 0.031 | $23,542,436 |
| PXX | Polarx Limited | 0% | -7% | 17% | -30% | -30% | 0.014 | $18,941,257 |
| AGG | AngloGold Ashanti | 0% | 4% | 21% | 34% | 38% | 7.89 | $704,741,344 |
| WGX | Westgold Resources. | 0% | 8% | 28% | 74% | -1% | 1.5225 | $722,274,663 |
| SFR | Sandfire Resources | 0% | -5% | 12% | 21% | 28% | 6.605 | $3,024,624,563 |
| EVN | Evolution Mining Ltd | 0% | 3% | 21% | 20% | -11% | 3.585 | $6,606,058,748 |
| ADT | Adriatic Metals | -1% | -4% | -4% | 12% | 44% | 3.54 | $805,813,917 |
| BGL | Bellevue Gold Ltd | -1% | 4% | 13% | 25% | 54% | 1.41 | $1,604,656,415 |
| RDT | Red Dirt Metals Ltd | -1% | 2% | 59% | -3% | -13% | 0.46 | $206,974,983 |
| GOR | Gold Road Res Ltd | -1% | 4% | 15% | 11% | 21% | 1.8675 | $2,038,216,429 |
| SBM | St Barbara Limited | -1% | 9% | -6% | -22% | -55% | 0.6025 | $498,090,403 |
| AAR | Astral Resources NL | -1% | -2% | 10% | 11% | -12% | 0.08 | $53,898,208 |
| ERM | Emmerson Resources | -1% | -3% | 6% | 1% | -31% | 0.076 | $41,942,654 |
| RXL | Rox Resources | -1% | 6% | 32% | 114% | -6% | 0.375 | $85,254,619 |
| BNZ | Benzmining | -1% | -1% | -5% | -10% | -47% | 0.37 | $27,395,550 |
| CHZ | Chesser Resources | -1% | -5% | -17% | -13% | -38% | 0.074 | $44,145,101 |
| SSR | SSR Mining Inc. | -1% | -3% | 2% | -4% | -25% | 22.07 | $410,884,465 |
| NWM | Norwest Minerals | -1% | -4% | 40% | -32% | -39% | 0.0365 | $9,152,735 |
| KCN | Kingsgate Consolid. | -1% | -5% | -29% | -18% | -3% | 1.42 | $362,906,669 |
| NVA | Nova Minerals Ltd | -1% | 1% | -22% | -48% | -49% | 0.355 | $75,920,319 |
| PNR | Pantoro Limited | -1% | 3% | 22% | -26% | -77% | 0.071 | $218,075,081 |
| PDI | Predictive Disc Ltd | -1% | -1% | 1% | -1% | -13% | 0.1775 | $322,293,368 |
| FAL | Falconmetalsltd | -1% | -10% | -3% | 25% | 6% | 0.35 | $62,835,000 |
| WAF | West African Res Ltd | -2% | -2% | -1% | -17% | -24% | 0.98 | $1,018,459,858 |
| CYL | Catalyst Metals | -2% | -4% | 2% | -18% | -47% | 0.965 | $171,191,127 |
| KRM | Kingsrose Mining Ltd | -2% | -7% | 7% | -5% | -17% | 0.062 | $47,409,171 |
| SVY | Stavely Minerals Ltd | -2% | -9% | -24% | -41% | -63% | 0.145 | $48,125,373 |
| HRZ | Horizon | -2% | -5% | 21% | -7% | -53% | 0.057 | $40,425,053 |
| OBM | Ora Banda Mining Ltd | -2% | -5% | 14% | 70% | 248% | 0.1425 | $233,615,332 |
| DEG | De Grey Mining | -2% | -3% | 4% | 25% | 37% | 1.605 | $2,560,313,741 |
| MGV | Musgrave Minerals | -2% | -2% | 13% | 7% | -32% | 0.225 | $135,977,828 |
| BEZ | Besragoldinc | -2% | -6% | 114% | 333% | 315% | 0.225 | $81,388,234 |
| BC8 | Black Cat Syndicate | -2% | 2% | 14% | 24% | -19% | 0.44 | $119,954,004 |
| RMS | Ramelius Resources | -2% | -5% | 11% | 41% | -11% | 1.31 | $1,170,153,219 |
| SLZ | Sultan Resources Ltd | -2% | -17% | -5% | -53% | -74% | 0.04 | $4,234,660 |
| ADN | Andromeda Metals Ltd | -2% | -7% | -11% | -9% | -60% | 0.04 | $127,510,346 |
| VMC | Venus Metals Cor Ltd | -3% | 3% | 22% | 44% | 5% | 0.195 | $35,615,737 |
| AZY | Antipa Minerals Ltd | -3% | 3% | 3% | -7% | -55% | 0.0195 | $71,860,817 |
| RRL | Regis Resources | -3% | -2% | 13% | 3% | 4% | 2.125 | $1,645,956,517 |
| PRU | Perseus Mining Ltd | -3% | -4% | -4% | 6% | 19% | 2.24 | $3,146,369,755 |
| KCC | Kincora Copper | -3% | 7% | 0% | -11% | -35% | 0.065 | $7,990,438 |
| LM8 | Lunnonmetalslimited | -3% | -2% | 4% | 26% | 3% | 1.13 | $128,019,770 |
| NST | Northern Star | -3% | -1% | 14% | 23% | 39% | 13.44 | $15,949,743,530 |
| IVR | Investigator Res Ltd | -3% | -6% | 51% | 48% | 0% | 0.062 | $91,978,881 |
| ZNC | Zenith Minerals Ltd | -3% | -7% | -16% | -42% | -64% | 0.155 | $56,272,967 |
| TBR | Tribune Res Ltd | -3% | -7% | 3% | -8% | -21% | 3.71 | $200,952,735 |
| KWR | Kingwest Resources | -3% | -3% | -3% | -14% | -85% | 0.03 | $8,733,531 |
| SVL | Silver Mines Limited | -3% | -3% | 27% | 11% | 1% | 0.2225 | $322,996,393 |
| ALK | Alkane Resources Ltd | -3% | 4% | 23% | 66% | -12% | 0.89 | $550,889,185 |
| USL | Unico Silver Limited | -3% | -5% | -3% | -18% | -35% | 0.14 | $36,156,789 |
| CMM | Capricorn Metals | -4% | 2% | -6% | -4% | 9% | 4.42 | $1,724,730,023 |
| MEK | Meeka Metals Limited | -4% | -12% | -4% | -37% | -7% | 0.043 | $48,042,402 |
| HCH | Hot Chili Ltd | -4% | -10% | 22% | 22% | -33% | 1.07 | $133,778,631 |
| SXG | Southern Cross Gold | -5% | -7% | -10% | -21% | 0% | 0.635 | $59,734,267 |
| NXM | Nexus Minerals Ltd | -5% | -38% | -32% | -48% | -67% | 0.105 | $35,799,864 |
| SNG | Siren Gold | -5% | -9% | 17% | -42% | -73% | 0.105 | $14,768,469 |
| STK | Strickland Metals | -5% | -2% | 14% | 3% | -43% | 0.041 | $66,862,510 |
| TTM | Titan Minerals | -5% | 0% | 0% | -9% | -36% | 0.061 | $90,321,484 |
| AM7 | Arcadia Minerals | -5% | 8% | 3% | -2% | -34% | 0.2 | $9,806,557 |
| AUT | Auteco Minerals | -5% | -9% | -2% | -22% | -47% | 0.04 | $97,139,125 |
| AQI | Alicanto Min Ltd | -5% | 3% | 14% | -7% | -58% | 0.04 | $22,520,972 |
| GAL | Galileo Mining Ltd | -5% | 12% | 15% | -10% | 276% | 0.79 | $164,028,689 |
| FML | Focus Minerals Ltd | -5% | 0% | 23% | -25% | -19% | 0.19 | $57,311,729 |
| KAU | Kaiser Reef | -5% | -7% | 15% | 15% | -7% | 0.19 | $28,339,536 |
| LEX | Lefroy Exploration | -5% | -7% | 23% | 2% | -15% | 0.265 | $44,928,241 |
| CBY | Canterbury Resources | -5% | -5% | -13% | -15% | -42% | 0.035 | $5,347,371 |
| HAV | Havilah Resources | -6% | -7% | -21% | -24% | 43% | 0.25 | $83,909,391 |
| GBZ | GBM Rsources Ltd | -6% | 3% | 14% | -26% | -72% | 0.032 | $19,147,460 |
| LCY | Legacy Iron Ore | -6% | 0% | 7% | -16% | -38% | 0.016 | $108,916,045 |
| CAI | Calidus Resources | -6% | -25% | -18% | -27% | -80% | 0.1975 | $92,305,676 |
| BMR | Ballymore Resources | -6% | 0% | -3% | 0% | -19% | 0.15 | $15,410,793 |
| WWI | West Wits Mining Ltd | -6% | -6% | 7% | -6% | -52% | 0.015 | $35,888,276 |
| XAM | Xanadu Mines Ltd | -6% | -12% | 19% | 52% | 26% | 0.044 | $76,977,737 |
| LYN | Lycaonresources | -6% | -12% | -15% | -47% | -65% | 0.145 | $5,102,406 |
| NML | Navarre Minerals Ltd | -7% | -7% | 0% | -32% | -67% | 0.028 | $45,086,374 |
| CY5 | Cygnus Metals Ltd | -7% | -14% | 35% | -34% | 56% | 0.25 | $50,523,537 |
| POL | Polymetals Resources | -8% | -11% | 47% | 14% | 143% | 0.28 | $13,780,721 |
| MXR | Maximus Resources | -8% | -18% | -13% | -18% | -64% | 0.033 | $11,486,008 |
| STN | Saturn Metals | -8% | -6% | 0% | -8% | -56% | 0.165 | $27,278,734 |
| NAE | New Age Exploration | -9% | 0% | 0% | -29% | -62% | 0.005 | $7,897,444 |
| MM8 | Medallion Metals. | -9% | -9% | -26% | -35% | -62% | 0.1 | $25,369,577 |
| RDS | Redstone Resources | -9% | 11% | 11% | 25% | 0% | 0.01 | $8,105,156 |
| PNM | Pacific Nickel Mines | -9% | -14% | 16% | 4% | -22% | 0.086 | $36,100,403 |
| PNT | Panthermetalsltd | -10% | -5% | -20% | -50% | -57% | 0.095 | $3,228,750 |
| MRZ | Mont Royal Resources | -10% | -14% | -32% | -51% | -74% | 0.085 | $6,437,371 |
| BBX | BBX Minerals Ltd | -10% | -11% | -31% | -31% | -37% | 0.072 | $40,457,718 |
| SRN | Surefire Rescs NL | -10% | -22% | -10% | 50% | -50% | 0.018 | $31,627,270 |
| MOM | Moab Minerals Ltd | -11% | 14% | 14% | -11% | -71% | 0.008 | $6,137,671 |
| RMX | Red Mount Min Ltd | -13% | 17% | -13% | -30% | -65% | 0.0035 | $9,087,404 |
| KNB | Koonenberrygold | -16% | -25% | -25% | -32% | -58% | 0.042 | $3,787,822 |
| RML | Resolution Minerals | -17% | 0% | 0% | -38% | -67% | 0.005 | $6,478,477 |
| MCT | Metalicity Limited | -20% | 0% | 0% | -33% | -68% | 0.002 | $8,761,348 |
| LRL | Labyrinth Resources | -20% | -8% | -8% | -29% | -69% | 0.012 | $14,392,310 |
| TAR | Taruga Minerals | -20% | -11% | 14% | -33% | -20% | 0.016 | $14,120,536 |
| FAU | First Au Ltd | -27% | -43% | -20% | 0% | -72% | 0.004 | $6,021,308 |
Friday Small Cap Standouts
CLASSIC MINERALS (ASX:CLZ)
With Aussie prices sitting above $3000/oz, CLZ is on the cusp of gold production at the perfect time.
Construction at its flagship 2,800oz Kat Gap mine in WA continued apace during the March quarter, with first production pencilled in for the current quarter.
A bulk sample stockpile is ready to be processed once the plant has been assembled.
The bulk sample has an estimated average grade of 4.82g/t for 1,011 ounces of contained gold, worth ~$3m at current prices.
It comes hot on the heels of a $20.1m institutional funding package to fast-track phase-1 development as well as extensional drilling across the wider project area, which is already coming up with the goods.
In January, the company announced a bunch of high-grade gold hits beneath the existing resource at Kat Gap, including 10m @ 9.26g/t Au from 57m.
BESRA GOLD (ASX:BEZ)
$80m capped BEZ is now up ~450% since inking a $US300m non-binding offtake and funding deal with bullion dealer and major shareholder Quantum Metal Recovery Inc in March.
This cash – paid over 30 months against future production ounces — would cover development of its 3Moz ‘Bau’ project in Malaysia’s Sarawak region.
BEZ has now received initial payment of $US2m from Quantum ahead of finalising the offtake funding facility. It is entitled to a further US$3m upon execution of the agreement, expected very soon.
The company is now updating an old feasibility study completed back in 2013, with initial results due in the second half of 2023. Pilot production is also pencilled in for later this year.
Meanwhile, assay results from 2022 drilling at Bekajang point to a high-grade feeder conduit system below the Bau Limestone-Pedawan Shale Contact (LSC).
Highlights like 12.6m @ 22.9g/t from 58.4m will be followed up, the company says.
WEST WITS MINING (ASX:WWI)
WWI continues to advance the 4.28Moz Witwatersrand Basin project (WBP) in South Africa toward first gold pour in Q4 this year.
In April, WWI received approval from South Africa’s Joburg City Power for a 7.5MVA power supply to its WBP’s Phase 1 Qala Shallows mine.
The approval of a 7.5MVA power supply is expected to reduce the DFS’ assumed timeline by six months or more, resulting in lower energy costs during the critical construction and build-up of the mine’s production.
Phase 1 production will average 55,000ozpa over an initial 10 years, at very good all-in sustaining costs of US$962/oz.
That culminates in pre-tax NPV and IRR of US$180m and 33%, respectively, at a conservative gold price of US$1750/oz.
Peak funding requirements are US$63m. The company says it is “in advanced discussions with multiple funders” to secure the optimum funding solution for the WBP.
A study on Phase 2 production up to 200,000ozpa is scheduled for this year.
The post Gold Digger: Are professional investors waking up these record silver deficits? appeared first on Stockhead.
asx ax gold silver zinc iron tsx-ssrm ssr-mining-inc ssr mining inc


Dolly Varden consolidates Big Bulk copper-gold porphyry by acquiring southern-portion claims – Richard Mills
2023.12.22
Dolly Varden Silver’s (TSXV:DV, OTCQX:DOLLF) stock price shot up 16 cents for a gain of 20% Thursday, after announcing a consolidation of…
Gold Digger: ‘Assured growth’ – central bank buying spree set to drive gold higher in 2024
Central banks will drive the price of gold higher in 2024, believe various analysts Spot gold prices seem stable to … Read More
The post Gold Digger:…

GoldTalks: Going big on ASX-listed gold stocks
Aussie investors are spoiled for choice when it comes to listed goldies, says Kyle Rodda. Here are 3 blue chips … Read More
The post GoldTalks: Going…