Precious Metals
How Big is that Chinese Gold Discovery Really?
Chinese media announced a major “50t” gold discovery over the weekend, containing metal worth “US$3 billion” In the grand scheme … Read More
The…
- Chinese media announced a major “50t” gold discovery over the weekend, containing metal worth “US$3 billion”
- In the grand scheme of things it doesn’t appear that big
- Christian joins Gold Digger live from France to unpack the US Fed meeting
Our Gold Digger column wraps all the news driving ASX stocks with exposure to precious metals.
A new Chinese gold discovery has tongues wagging but, as usual, the rumour mill of international mining PR leaves plenty to be desired in specifics.
The Xialaokou mine in Rushan in East China’s Shandong Province came out with a couple big headline numbers, with the China Media Group reporting over the weekend it was the largest discovery in the province this year and largest known deposit in the region at a 50 tonne reserve.
That’s been estimated by other media as containing US$3 billion worth of gold, the sort of reporting that would get an ASX junior a hard spank from ASIC and the ASX for misleading the market.
It’s a reminder that international reporting on mineral resources and production leaves a lot to be desired when compared to Australia and its stringent JORC Code.
Anyone remember that 8.5Mt Iranian lithium deposit? Sounds huge; in reality, not so much.
China is in actuality a major gold producer. Eclipsed briefly by Australia as the world’s top gold miner, China has been the biggest producer since the pandemic, with Australia’s output curbed amid labour shortages, Covid outbreaks and border closures.
But China is a land with many gold mines, not mega gold mines. Its largest single operation, Jiaojia, produced in the order of 10t last year.
That wouldn’t put Jiaojia in the same class as any of Australia’s top five producers, and at 50t, or around 1.6 million troy ounces (whether that is reserves or resources is still unclear), Xilaokou would still pale in comparison to De Grey Mining’s (ASX:DEG) world class Hemi, which boasts an ore reserve of 5.1Moz at 1.5g/t gold from total resources of 8.5Moz.
Even Red 5’s (ASX:RED) brownfields King of the Hills mine has a reserve of 2.4Moz.
Xilaokou, announced as a major discovery by the Shandong Provincial Bureau of Geology and Mineral Resources, can no doubt get bigger, but it is worth taking bullish announcements by the Global Times and other international media with a grain of salt.
The good thing about gold is it doesn’t come with the same mineral competition as other commodities. The market is so big and diverse that pricing is typically based on investment demand rather than supply dynamics.
US Fed from Christian (change this header obv.
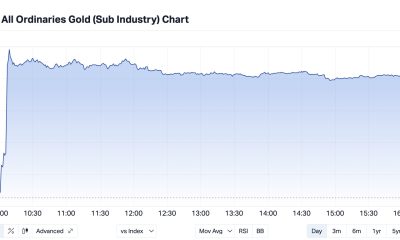
A dour day for gold miners
Yesterday was a rough one for our watchlist of gold producers, with Northern Star (ASX:NST), Evolution Mining (ASX:EVN), St Barbara (ASX:SBM), Gold Road (ASX:GOR) and Regis Resources (ASX:RRL) all among the top gold miners to drop more than 5% as the banking crisis looked to be contained for now.
That came after US treasury secretary Janet Yellen quietly said the Biden Administration would step in to prevent the collapse of small banks like Silicon Valley Bank from leaving depositors out of pocket.
Devastating for gold miners, who do best when the world burns. Safe haven support had previously sent prices to Aussie records in the vicinity of $3000/oz.
In better news Aeris Resources (ASX:AIS) rose over 5% after announcing a new polymetallic sulphide lens had been discovered at its Jaguar mine in WA, raising the prospect of a life extension at the copper, zinc, silver and gold orebody.
Winners & Losers
Here’s how ASX-listed precious metals stocks are performing:
Scroll or swipe to reveal table. Click headings to sort. Best viewed on a laptop.
Stocks missing from this list? Email [email protected]
| CODE | COMPANY | PRICE | DAY RETURN % | 1 WEEK RETURN % | 1 MONTH RETURN % | 6 MONTH RETURN % | 1 YEAR RETURN % | MARKET CAP |
|---|---|---|---|---|---|---|---|---|
| MRR | Minrex Resources Ltd | 0.021 | 0% | -22% | -36% | -58% | -64% | $ 22,782,217.56 |
| NPM | Newpeak Metals | 0.001 | 0% | 0% | 0% | 0% | 0% | $ 9,145,131.70 |
| ASO | Aston Minerals Ltd | 0.1 | -5% | -5% | 0% | 15% | -35% | $ 116,920,748.07 |
| MTC | Metalstech Ltd | 0.355 | 4% | -13% | -23% | -11% | 39% | $ 60,292,060.60 |
| FFX | Firefinch Ltd | 0.2 | 0% | 0% | 0% | 0% | -29% | $ 236,569,315.40 |
| GED | Golden Deeps | 0.008 | 0% | 0% | -20% | -43% | -20% | $ 9,241,813.71 |
| G88 | Golden Mile Res Ltd | 0.016 | 7% | 0% | -21% | -48% | -74% | $ 3,068,846.34 |
| DCX | Discovex Res Ltd | 0.003 | 0% | 0% | -14% | -40% | -65% | $ 9,907,704.29 |
| NMR | Native Mineral Res | 0.056 | 0% | -14% | -20% | -65% | -74% | $ 6,727,769.16 |
| AQX | Alice Queen Ltd | 0.001 | 0% | -33% | 0% | -67% | -88% | $ 2,530,287.61 |
| SLZ | Sultan Resources Ltd | 0.051 | -9% | -7% | -2% | -49% | -67% | $ 4,663,925.78 |
| MKG | Mako Gold | 0.041 | -7% | 3% | 3% | -21% | -54% | $ 20,752,659.80 |
| KSN | Kingston Resources | 0.09 | -3% | 10% | -14% | 3% | -42% | $ 38,655,790.01 |
| AMI | Aurelia Metals Ltd | 0.105 | 0% | 9% | -5% | -52% | -78% | $ 129,930,907.68 |
| PNX | PNX Metals Limited | 0.003 | 0% | 20% | 0% | -20% | -36% | $ 16,141,874.16 |
| GIB | Gibb River Diamonds | 0.052 | -13% | -5% | -5% | -4% | -9% | $ 12,690,566.70 |
| KCN | Kingsgate Consolid. | 1.76 | -3% | 11% | 14% | 17% | 20% | $ 402,803,224.46 |
| TMX | Terrain Minerals | 0.005 | 0% | 0% | -17% | -38% | -29% | $ 5,415,996.54 |
| BNR | Bulletin Res Ltd | 0.087 | -1% | -4% | -17% | -33% | -44% | $ 25,836,016.80 |
| NXM | Nexus Minerals Ltd | 0.16 | 0% | -6% | -9% | -22% | -60% | $ 52,072,529.44 |
| SKY | SKY Metals Ltd | 0.043 | -4% | -7% | -4% | -17% | -52% | $ 16,955,256.15 |
| LM8 | Lunnonmetalslimited | 1.06 | 6% | 9% | 17% | 18% | 19% | $ 109,876,127.00 |
| CST | Castile Resources | 0.087 | 0% | -5% | -12% | -24% | -49% | $ 21,045,511.15 |
| YRL | Yandal Resources | 0.091 | 0% | -2% | -1% | -41% | -60% | $ 14,360,080.19 |
| FAU | First Au Ltd | 0.0035 | 17% | 17% | 0% | -42% | -61% | $ 3,284,349.80 |
| ARL | Ardea Resources Ltd | 0.51 | 13% | 7% | -17% | -43% | -58% | $ 77,176,247.40 |
| GWR | GWR Group Ltd | 0.105 | -5% | 24% | 81% | 27% | -31% | $ 35,333,832.05 |
| AGG | AngloGold Ashanti | 6.3 | 1% | 12% | 16% | 68% | -2% | $ 555,764,375.95 |
| IVR | Investigator Res Ltd | 0.04 | -5% | -2% | 3% | -20% | -41% | $ 60,360,873.59 |
| GTR | Gti Energy Ltd | 0.011 | 2% | 18% | -7% | -44% | -65% | $ 16,287,074.10 |
| IPT | Impact Minerals | 0.01 | 0% | 11% | 0% | 43% | -6% | $ 24,813,705.56 |
| BNZ | Benzmining | 0.39 | -1% | 3% | -12% | -26% | -37% | $ 29,016,943.72 |
| MOH | Moho Resources | 0.018 | 13% | -5% | 6% | -41% | -67% | $ 3,322,595.26 |
| BBX | BBX Minerals Ltd | 0.115 | 0% | 0% | -23% | 67% | -26% | $ 56,432,969.63 |
| PUA | Peak Minerals Ltd | 0.005 | 0% | 11% | 0% | -44% | -60% | $ 5,206,883.09 |
| MRZ | Mont Royal Resources | 0.165 | 0% | -13% | -15% | -28% | -42% | $ 11,299,640.22 |
| SMS | Starmineralslimited | 0.07 | 0% | 4% | 0% | -20% | -65% | $ 2,109,925.86 |
| MVL | Marvel Gold Limited | 0.018 | 0% | 0% | -14% | -36% | -60% | $ 12,691,698.66 |
| PRX | Prodigy Gold NL | 0.01 | -9% | 0% | 0% | -9% | -57% | $ 19,226,711.00 |
| AAU | Antilles Gold Ltd | 0.037 | -3% | -8% | 0% | -24% | -49% | $ 18,517,804.05 |
| CWX | Carawine Resources | 0.098 | 0% | -1% | -2% | 2% | -53% | $ 19,288,111.86 |
| RND | Rand Mining Ltd | 1.39 | 1% | 7% | 1% | -7% | -12% | $ 77,920,066.57 |
| CAZ | Cazaly Resources | 0.024 | -8% | -11% | -14% | -35% | -43% | $ 9,667,366.62 |
| BMR | Ballymore Resources | 0.165 | 3% | 18% | 0% | -25% | -6% | $ 15,410,792.96 |
| DRE | Dreadnought Resources Ltd | 0.058 | -3% | -13% | -35% | -50% | 45% | $ 197,623,693.20 |
| ZNC | Zenith Minerals Ltd | 0.19 | 0% | -7% | -17% | -37% | -41% | $ 66,824,148.36 |
| REZ | Resourc & En Grp Ltd | 0.013 | 0% | -13% | 8% | -38% | -68% | $ 6,497,475.26 |
| LEX | Lefroy Exploration | 0.225 | 10% | 5% | 0% | -32% | -32% | $ 32,893,890.41 |
| ERM | Emmerson Resources | 0.077 | 0% | 7% | 4% | -4% | -41% | $ 41,942,653.68 |
| AM7 | Arcadia Minerals | 0.195 | -7% | -9% | -11% | -37% | -15% | $ 9,806,557.32 |
| ADT | Adriatic Metals | 3.71 | 1% | 5% | 14% | 70% | 67% | $ 808,606,086.78 |
| GMR | Golden Rim Resources | 0.0305 | 0% | 5% | -2% | -32% | -59% | $ 18,043,445.22 |
| CYL | Catalyst Metals | 0.97 | -2% | -15% | -29% | -18% | -51% | $ 169,133,590.57 |
| CHN | Chalice Mining Ltd | 6.36 | 0% | 5% | 2% | 58% | -11% | $ 2,390,439,681.90 |
| KAL | Kalgoorliegoldmining | 0.054 | 8% | -10% | -31% | -60% | -66% | $ 3,871,730.00 |
| MLS | Metals Australia | 0.037 | 3% | -10% | -23% | -23% | -52% | $ 21,853,302.88 |
| ADN | Andromeda Metals Ltd | 0.044 | 0% | 0% | -2% | -6% | -77% | $ 136,840,371.01 |
| MEI | Meteoric Resources | 0.13 | 13% | 18% | -4% | 767% | 829% | $ 175,683,755.45 |
| SRN | Surefire Rescs NL | 0.019 | 6% | 6% | 36% | 36% | 46% | $ 28,464,542.59 |
| SIH | Sihayo Gold Limited | 0.001 | 0% | -50% | -50% | -60% | -83% | $ 6,102,128.09 |
| WA8 | Warriedarresourltd | 0.145 | 4% | -3% | -15% | -3% | -3% | $ 60,348,233.68 |
| HMX | Hammer Metals Ltd | 0.053 | -2% | -4% | -23% | 10% | -50% | $ 44,355,996.85 |
| WCN | White Cliff Min Ltd | 0.009 | -10% | -10% | -25% | -57% | -68% | $ 7,840,544.10 |
| AVM | Advance Metals Ltd | 0.008 | 0% | 0% | -20% | -33% | -47% | $ 4,656,352.55 |
| WRM | White Rock Min Ltd | 0.063 | 0% | -7% | 2% | -25% | -69% | $ 17,373,120.66 |
| ASR | Asra Minerals Ltd | 0.012 | 9% | 0% | -14% | -56% | -54% | $ 16,138,305.44 |
| MCT | Metalicity Limited | 0.002 | -33% | 0% | -20% | -50% | -65% | $ 10,513,618.02 |
| AME | Alto Metals Limited | 0.066 | 0% | 5% | -6% | -6% | -31% | $ 40,445,821.61 |
| CTO | Citigold Corp Ltd | 0.005 | 0% | 0% | 0% | -17% | -38% | $ 14,168,295.46 |
| TIE | Tietto Minerals | 0.595 | 3% | 3% | -13% | 24% | 3% | $ 630,765,944.20 |
| SMI | Santana Minerals Ltd | 0.755 | 1% | 13% | -12% | 9% | 36% | $ 111,583,198.50 |
| M2R | Miramar | 0.048 | 7% | 0% | -33% | -54% | -72% | $ 3,180,678.44 |
| MHC | Manhattan Corp Ltd | 0.005 | 0% | -17% | -17% | -38% | -64% | $ 8,773,307.11 |
| GRL | Godolphin Resources | 0.065 | 0% | 18% | -14% | -24% | -54% | $ 7,694,014.06 |
| TRY | Troy Resources Ltd | 0.0295 | 0% | 0% | 0% | 0% | 0% | $ 62,920,961.44 |
| CGN | Crater Gold Min Ltd | 0.014499 | 0% | 0% | 0% | 0% | 0% | $ 17,965,036.68 |
| SVG | Savannah Goldfields | 0.18 | 0% | 6% | -5% | -36% | -18% | $ 33,992,718.84 |
| EMC | Everest Metals Corp | 0.079 | 5% | -7% | -12% | -21% | -25% | $ 7,982,483.18 |
| GUL | Gullewa Limited | 0.056 | 0% | 0% | 8% | -7% | -18% | $ 10,963,293.60 |
| CY5 | Cygnus Metals Ltd | 0.225 | -4% | -27% | -31% | -10% | 32% | $ 43,210,439.82 |
| G50 | Gold50Limited | 0.235 | 7% | 2% | 21% | 68% | -6% | $ 12,527,460.22 |
| ADV | Ardiden Ltd | 0.007 | 0% | 0% | 0% | -13% | -42% | $ 18,818,347.49 |
| AAR | Astral Resources NL | 0.078 | 4% | 11% | 4% | -2% | -28% | $ 49,905,748.43 |
| MGV | Musgrave Minerals | 0.185 | -3% | 6% | 9% | -21% | -44% | $ 112,329,510.31 |
| AGS | Alliance Resources | 0 | 0% | -100% | -100% | -100% | -100% | $ 41,303,448.03 |
| VMC | Venus Metals Cor Ltd | 0.15 | 0% | 0% | 0% | -9% | -14% | $ 26,711,802.45 |
| NAE | New Age Exploration | 0.005 | -17% | -17% | -17% | -44% | -58% | $ 8,615,393.46 |
| VKA | Viking Mines Ltd | 0.01 | 0% | 0% | -17% | 11% | -9% | $ 10,252,584.31 |
| LCL | Los Cerros Limited | 0.035 | 9% | 17% | -1% | 18% | -66% | $ 23,057,905.76 |
| MTH | Mithril Resources | 0.002 | 0% | 0% | -33% | -60% | -83% | $ 6,526,180.37 |
| ADG | Adelong Gold Limited | 0.01 | 0% | 0% | 0% | 0% | -71% | $ 5,338,222.92 |
| RMX | Red Mount Min Ltd | 0.0035 | -13% | -13% | -30% | -42% | -56% | $ 9,087,404.15 |
| PRS | Prospech Limited | 0.023125 | 0% | 4% | -4% | -26% | -48% | $ 2,041,904.96 |
| XTC | Xantippe Res Ltd | 0.004 | -20% | -33% | -33% | -56% | -33% | $ 52,900,498.47 |
| TTM | Titan Minerals | 0.06 | -3% | -12% | -2% | -6% | -37% | $ 87,498,937.53 |
| NML | Navarre Minerals Ltd | 0.03 | 3% | -9% | -14% | -36% | -69% | $ 43,583,495.32 |
| RXL | Rox Resources | 0.31 | 3% | 15% | 114% | 11% | -22% | $ 67,306,278.00 |
| MZZ | Matador Mining Ltd | 0.082 | 3% | -4% | -6% | -25% | -70% | $ 25,217,506.72 |
| KZR | Kalamazoo Resources | 0.13 | -5% | -10% | -21% | -45% | -55% | $ 20,600,163.93 |
| BCN | Beacon Minerals | 0.028 | 0% | 0% | 0% | 17% | -22% | $ 105,189,508.79 |
| MAU | Magnetic Resources | 0.66 | 0% | -8% | -6% | -31% | -55% | $ 151,478,171.46 |
| BC8 | Black Cat Syndicate | 0.34 | -1% | -8% | -7% | 3% | -40% | $ 91,822,423.79 |
| EM2 | Eagle Mountain | 0.165 | 0% | -8% | -18% | -35% | -65% | $ 50,319,532.40 |
| EMR | Emerald Res NL | 1.545 | -3% | 4% | 4% | 38% | 46% | $ 941,174,558.06 |
| BYH | Bryah Resources Ltd | 0.0175 | -3% | -3% | -30% | -38% | -64% | $ 5,062,562.53 |
| HCH | Hot Chili Ltd | 0.88 | -4% | -1% | -1% | -19% | -32% | $ 109,292,363.49 |
| WAF | West African Res Ltd | 0.965 | -4% | 1% | 7% | -11% | -26% | $ 1,023,516,370.00 |
| MEU | Marmota Limited | 0.039 | 3% | 8% | -11% | -17% | -9% | $ 40,234,421.85 |
| NVA | Nova Minerals Ltd | 0.44 | 0% | 0% | -24% | -41% | -36% | $ 92,791,501.44 |
| DCN | Dacian Gold Ltd | 0.078 | -3% | -13% | -12% | -9% | -69% | $ 97,344,075.04 |
| SVL | Silver Mines Limited | 0.16 | -3% | 3% | 7% | -9% | -35% | $ 231,663,241.10 |
| PGD | Peregrine Gold | 0.395 | 8% | -4% | -7% | -33% | -13% | $ 14,307,824.80 |
| ICL | Iceni Gold | 0.089 | -1% | 1% | -9% | -6% | -23% | $ 11,537,678.52 |
| FG1 | Flynngold | 0.075 | -4% | -7% | -17% | -35% | -42% | $ 8,024,135.89 |
| WWI | West Wits Mining Ltd | 0.013 | 0% | 0% | 0% | -19% | -63% | $ 28,069,347.01 |
| RML | Resolution Minerals | 0.006 | 0% | 20% | -25% | -40% | -67% | $ 6,478,477.15 |
| AAJ | Aruma Resources Ltd | 0.055 | 0% | -2% | -15% | -14% | -44% | $ 8,632,882.67 |
| AL8 | Alderan Resource Ltd | 0.007 | 0% | 0% | 0% | -30% | -61% | $ 4,047,862.56 |
| GMN | Gold Mountain Ltd | 0.004 | 0% | 0% | -20% | -50% | -56% | $ 7,879,730.46 |
| MEG | Megado Minerals Ltd | 0.038 | 0% | -7% | -34% | -53% | -53% | $ 5,436,111.20 |
| HMG | Hamelingoldlimited | 0.099 | 10% | 15% | -1% | -32% | -36% | $ 9,900,000.00 |
| HMG | Hamelingoldlimited | 0.099 | 10% | 15% | -1% | -32% | -36% | $ 9,900,000.00 |
| TBA | Tombola Gold Ltd | 0.026 | 0% | 0% | 0% | -28% | -28% | $ 33,129,242.98 |
| BM8 | Battery Age Minerals | 0.36 | 0% | 0% | -29% | -28% | -9% | $ 26,718,538.68 |
| TBR | Tribune Res Ltd | 3.5 | -1% | 2% | -1% | 0% | -23% | $ 186,261,673.35 |
| FML | Focus Minerals Ltd | 0.185 | 0% | 6% | 12% | 42% | -26% | $ 53,013,349.33 |
| GSR | Greenstone Resources | 0.021 | -5% | 5% | -13% | -69% | -46% | $ 26,568,937.47 |
| VRC | Volt Resources Ltd | 0.011 | 10% | 0% | 0% | -62% | -8% | $ 39,394,238.79 |
| ARV | Artemis Resources | 0.015 | 0% | 15% | -17% | -69% | -77% | $ 23,421,275.57 |
| HRN | Horizon Gold Ltd | 0.34 | 0% | 13% | 0% | -4% | -21% | $ 42,561,757.94 |
| CLA | Celsius Resource Ltd | 0.016 | 7% | 0% | -6% | 23% | -36% | $ 27,858,060.65 |
| QML | Qmines Limited | 0.16 | 0% | -3% | -11% | 19% | -35% | $ 14,433,445.12 |
| RDN | Raiden Resources Ltd | 0.004 | 0% | 0% | -20% | -50% | -64% | $ 6,618,329.83 |
| TCG | Turaco Gold Limited | 0.066 | 0% | 6% | 5% | 25% | -43% | $ 28,229,300.15 |
| KCC | Kincora Copper | 0.07 | 0% | -1% | -3% | 4% | -46% | $ 8,348,218.62 |
| GBZ | GBM Rsources Ltd | 0.032 | 3% | 0% | -9% | -22% | -73% | $ 17,445,732.92 |
| DTM | Dart Mining NL | 0.045 | 18% | 5% | 13% | -50% | -44% | $ 5,913,581.28 |
| MKR | Manuka Resources. | 0.067 | 24% | 3% | -19% | -54% | -76% | $ 27,151,282.73 |
| AUC | Ausgold Limited | 0.05 | 0% | 0% | 4% | 16% | 0% | $ 101,473,727.05 |
| ANX | Anax Metals Ltd | 0.06 | 0% | -12% | -19% | -12% | -28% | $ 24,563,689.62 |
| EMU | EMU NL | 0.002 | 0% | 0% | -50% | -64% | -85% | $ 2,900,042.56 |
| SFM | Santa Fe Minerals | 0.058 | 0% | -15% | -23% | -32% | -64% | $ 4,223,489.76 |
| SSR | SSR Mining Inc. | 20.8 | -3% | 0% | 3% | 0% | -28% | $ 400,154,445.95 |
| PNR | Pantoro Limited | 0.061 | -9% | 13% | 2% | -66% | -80% | $ 137,058,125.02 |
| CMM | Capricorn Metals | 4.57 | -3% | 2% | 15% | 61% | 22% | $ 1,777,336,167.75 |
| X64 | Ten Sixty Four Ltd | 0.57 | 0% | 0% | -1% | -7% | -37% | $ 130,184,181.57 |
| SI6 | SI6 Metals Limited | 0.005 | -9% | -17% | 0% | -29% | -50% | $ 8,224,670.26 |
| HAW | Hawthorn Resources | 0.084 | -3% | -5% | -18% | -13% | 9% | $ 29,146,358.33 |
| BGD | Bartongoldholdings | 0.22 | 0% | 4% | -12% | 42% | -17% | $ 18,993,281.34 |
| SVY | Stavely Minerals Ltd | 0.18 | -3% | -5% | -28% | 9% | -54% | $ 60,337,512.65 |
| KWR | Kingwest Resources | 0.031 | 0% | 3% | -23% | -28% | -80% | $ 8,733,531.36 |
| AGC | AGC Ltd | 0.055 | 6% | 8% | -7% | -25% | -39% | $ 5,200,000.00 |
| AGC | AGC Ltd | 0.055 | 6% | 8% | -7% | -25% | -39% | $ 5,200,000.00 |
| RVR | Red River Resources | 0.073 | 0% | 0% | 0% | -16% | -68% | $ 37,847,907.62 |
| RGL | Riversgold | 0.015 | 0% | 0% | -38% | -63% | -54% | $ 14,182,015.71 |
| TSO | Tesoro Gold Ltd | 0.028 | -3% | -3% | -3% | -21% | -65% | $ 30,551,864.56 |
| OKR | Okapi Resources | 0.145 | 0% | 0% | -12% | -48% | -50% | $ 23,947,109.46 |
| CPM | Coopermetalslimited | 0.245 | 2% | 14% | -17% | -34% | -36% | $ 9,862,800.24 |
| MM8 | Medallion Metals. | 0.125 | 0% | 19% | -4% | -26% | -48% | $ 17,494,382.38 |
| TRN | Torrens Mining | 0 | 0% | -100% | -100% | -100% | -100% | $ 9,218,941.94 |
| AUT | Auteco Minerals | 0.042 | -2% | -5% | 0% | 2% | -42% | $ 99,451,960.90 |
| CBY | Canterbury Resources | 0.04 | 0% | 0% | -2% | 14% | -47% | $ 5,760,941.20 |
| LYN | Lycaonresources | 0.185 | -5% | -12% | -23% | -48% | -56% | $ 6,419,156.25 |
| SFR | Sandfire Resources | 5.77 | 3% | 4% | -12% | 48% | 9% | $ 2,563,163,716.08 |
| NCM | Newcrest Mining | 25.54 | -1% | 3% | 8% | 52% | 1% | $ 23,066,624,695.82 |
| TMZ | Thomson Res Ltd | 0.005 | 0% | 0% | -29% | -78% | -91% | $ 4,349,755.19 |
| TAM | Tanami Gold NL | 0.034 | -3% | -6% | -3% | -17% | -41% | $ 41,128,396.61 |
| WMC | Wiluna Mining Corp | 0.205 | 0% | 0% | 0% | 0% | -74% | $ 74,238,030.68 |
| NWM | Norwest Minerals | 0.027 | -13% | -21% | -59% | -37% | -56% | $ 6,885,329.00 |
| ALK | Alkane Resources Ltd | 0.71 | -2% | 7% | 14% | -2% | -35% | $ 434,124,629.20 |
| BMO | Bastion Minerals | 0.028 | 0% | 0% | -24% | -69% | -83% | $ 4,463,524.38 |
| IDA | Indiana Resources | 0.05 | 4% | 0% | -12% | -23% | -15% | $ 24,057,831.31 |
| GSM | Golden State Mining | 0.032 | 0% | -14% | -22% | -30% | -59% | $ 3,744,454.53 |
| NSM | Northstaw | 0.155 | 0% | 11% | -16% | 0% | -47% | $ 18,619,685.00 |
| GSN | Great Southern | 0.018 | 0% | -10% | -22% | -47% | -64% | $ 11,943,125.69 |
| RED | Red 5 Limited | 0.14 | 0% | 8% | -20% | -38% | -61% | $ 449,643,490.80 |
| DEG | De Grey Mining | 1.52 | -3% | 6% | 10% | 48% | 26% | $ 2,458,837,891.13 |
| THR | Thor Energy PLC | 0.005 | 25% | 25% | -9% | -50% | -64% | $ 5,912,451.38 |
| CDR | Codrus Minerals Ltd | 0.087 | -3% | -8% | -21% | 16% | -13% | $ 3,638,700.00 |
| MDI | Middle Island Res | 0.04 | 0% | -13% | -25% | -38% | -68% | $ 4,896,728.88 |
| BAT | Battery Minerals Ltd | 0.004 | 0% | 0% | 0% | -20% | -60% | $ 11,740,969.38 |
| POL | Polymetals Resources | 0.1925 | 4% | -26% | 4% | 20% | 60% | $ 8,358,798.02 |
| RDS | Redstone Resources | 0.01 | 0% | 0% | 0% | 25% | 0% | $ 7,368,323.96 |
| NAG | Nagambie Resources | 0.046 | 0% | -15% | -18% | -44% | -18% | $ 24,641,914.66 |
| BGL | Bellevue Gold Ltd | 1.16 | -4% | -3% | 11% | 56% | 21% | $ 1,366,257,076.80 |
| GBR | Greatbould Resources | 0.082 | -8% | -17% | 4% | -17% | -50% | $ 38,355,881.62 |
| KAI | Kairos Minerals Ltd | 0.019 | -10% | 19% | -5% | -50% | -27% | $ 41,245,963.31 |
| KAU | Kaiser Reef | 0.175 | -3% | 3% | 0% | 0% | -17% | $ 25,505,582.76 |
| HRZ | Horizon | 0.05 | 0% | 2% | -19% | -31% | -55% | $ 31,142,310.75 |
| CAI | Calidus Resources | 0.225 | -4% | -6% | -10% | -59% | -76% | $ 103,294,447.40 |
| CDT | Castle Minerals | 0.018 | 0% | -14% | -25% | -40% | -68% | $ 20,240,873.71 |
| RSG | Resolute Mining | 0.365 | -3% | 24% | 46% | 85% | 25% | $ 798,377,463.38 |
| MXR | Maximus Resources | 0.035 | 0% | 9% | -3% | -30% | -44% | $ 11,166,951.88 |
| EVN | Evolution Mining Ltd | 2.81 | -3% | 0% | -3% | 40% | -36% | $ 5,321,547,325.10 |
| AXE | Archer Materials | 0.45 | -2% | -3% | -21% | -45% | -51% | $ 114,524,915.22 |
| CXU | Cauldron Energy Ltd | 0.008 | 33% | 33% | 14% | -41% | -48% | $ 5,589,408.01 |
| RDT | Red Dirt Metals Ltd | 0.32 | -2% | -12% | -26% | -48% | -42% | $ 144,594,934.25 |
| ALY | Alchemy Resource Ltd | 0.014 | 0% | -7% | -13% | -33% | 8% | $ 16,493,067.58 |
| HXG | Hexagon Energy | 0.011 | 0% | -15% | -39% | -35% | -79% | $ 5,642,074.91 |
| OBM | Ora Banda Mining Ltd | 0.13 | -7% | 0% | 24% | 128% | 165% | $ 199,610,912.76 |
| SLR | Silver Lake Resource | 1.09 | -6% | -1% | 0% | -3% | -49% | $ 1,073,854,704.62 |
| VAN | Vango Mining Ltd | 0 | 0% | -100% | -100% | -100% | -100% | $ 59,217,068.70 |
| AVW | Avira Resources Ltd | 0.003 | 50% | 0% | 20% | -25% | -50% | $ 4,267,580.00 |
| LCY | Legacy Iron Ore | 0.017 | 0% | -6% | 6% | -15% | -11% | $ 108,916,045.38 |
| PDI | Predictive Disc Ltd | 0.175 | -3% | 0% | 3% | 0% | -19% | $ 321,413,766.48 |
| MAT | Matsa Resources | 0.038 | 3% | -3% | -7% | -5% | -40% | $ 15,244,170.94 |
| ZAG | Zuleika Gold Ltd | 0.014 | 0% | 8% | -15% | -26% | -55% | $ 7,322,708.75 |
| GML | Gateway Mining | 0.044 | 2% | -10% | -12% | -51% | -63% | $ 11,452,342.35 |
| SBM | St Barbara Limited | 0.64 | -4% | 10% | 0% | -19% | -58% | $ 543,000,193.93 |
| SBR | Sabre Resources | 0.025 | 0% | -14% | -28% | -58% | -50% | $ 7,287,154.68 |
| STK | Strickland Metals | 0.036 | -3% | 0% | 0% | -18% | -31% | $ 57,532,364.12 |
| SAU | Southern Gold | 0.022 | 16% | 13% | -4% | -37% | -60% | $ 5,705,420.30 |
| CEL | Challenger Exp Ltd | 0.115 | 0% | 5% | -16% | -36% | -65% | $ 120,268,729.49 |
| LRL | Labyrinth Resources | 0.0145 | 61% | 12% | -15% | -42% | -65% | $ 8,635,386.09 |
| NST | Northern Star | 11.22 | -4% | 0% | 2% | 49% | 8% | $ 13,385,365,154.40 |
| OZM | Ozaurum Resources | 0.042 | 0% | -7% | -35% | -60% | -58% | $ 5,334,000.00 |
| TG1 | Techgen Metals Ltd | 0.06 | -3% | -13% | -25% | -67% | -48% | $ 3,429,644.51 |
| XAM | Xanadu Mines Ltd | 0.036 | 9% | 13% | 22% | 13% | 24% | $ 54,048,198.30 |
| CHZ | Chesser Resources | 0.091 | -3% | -2% | 1% | 15% | -21% | $ 55,328,526.71 |
| AQI | Alicanto Min Ltd | 0.04 | -9% | -17% | -22% | -17% | -59% | $ 19,633,399.15 |
| KTA | Krakatoa Resources | 0.029 | -3% | -6% | -31% | -55% | -41% | $ 10,341,297.51 |
| ARN | Aldoro Resources | 0.2 | -5% | -13% | 5% | -9% | -38% | $ 23,711,586.57 |
| WGX | Westgold Resources. | 1.12 | -2% | 3% | 15% | 38% | -44% | $ 539,929,912.20 |
| MBK | Metal Bank Ltd | 0.029 | -3% | 0% | 38% | -28% | -59% | $ 8,294,565.60 |
| A8G | Australasian Metals | 0.16 | 10% | 19% | -11% | -46% | -67% | $ 5,969,721.63 |
| TAR | Taruga Minerals | 0.014 | -13% | -13% | -22% | -56% | -50% | $ 11,296,428.56 |
| DTR | Dateline Resources | 0.018 | 0% | -5% | -36% | -81% | -81% | $ 11,469,816.32 |
| GOR | Gold Road Res Ltd | 1.57 | -4% | 3% | 8% | 24% | -6% | $ 1,767,730,522.60 |
| S2R | S2 Resources | 0.135 | -4% | 4% | -7% | -4% | -25% | $ 57,412,813.08 |
| NES | Nelson Resources. | 0.006 | 50% | 20% | -14% | -52% | -68% | $ 2,354,377.31 |
| TLM | Talisman Mining | 0.14 | 4% | 0% | -18% | 0% | -22% | $ 25,344,832.10 |
| BEZ | Besragoldinc | 0.072 | 20% | 80% | 64% | 83% | 1% | $ 21,231,713.28 |
| PRU | Perseus Mining Ltd | 2.19 | -5% | 3% | 16% | 52% | 14% | $ 3,145,165,159.90 |
| SPQ | Superior Resources | 0.054 | -4% | 0% | -11% | 2% | 4% | $ 95,268,343.41 |
| PUR | Pursuit Minerals | 0.02 | 0% | 0% | -26% | 33% | 0% | $ 23,745,017.34 |
| RMS | Ramelius Resources | 1.1 | -1% | 1% | 27% | 67% | -28% | $ 969,306,024.81 |
| PKO | Peako Limited | 0.01 | 0% | 0% | -23% | -57% | -38% | $ 3,792,152.82 |
| ICG | Inca Minerals Ltd | 0.02 | -5% | -9% | -9% | -43% | -81% | $ 10,139,920.83 |
| A1G | African Gold Ltd. | 0.066 | -11% | -12% | -24% | -2% | -58% | $ 12,529,029.61 |
| OAU | Ora Gold Limited | 0.002 | 0% | -20% | -50% | -64% | -79% | $ 7,873,850.26 |
| GNM | Great Northern | 0.0035 | 0% | 17% | -13% | -13% | -30% | $ 5,981,678.42 |
| KRM | Kingsrose Mining Ltd | 0.0595 | -2% | -4% | -10% | 17% | -23% | $ 45,904,117.66 |
| BTR | Brightstar Resources | 0.017 | 6% | 6% | -11% | 6% | -39% | $ 13,266,061.17 |
| RRL | Regis Resources | 1.79 | -5% | 0% | -6% | 20% | -14% | $ 1,423,223,868.63 |
| M24 | Mamba Exploration | 0.08 | -11% | -30% | -58% | -45% | -48% | $ 5,488,500.42 |
| TRM | Truscott Mining Corp | 0.047 | 0% | 12% | -68% | 18% | 47% | $ 7,856,381.82 |
| DEX | Duke Exploration | 0.053 | 0% | 0% | 0% | 6% | -71% | $ 5,587,240.23 |
| MOM | Moab Minerals Ltd | 0.008 | 0% | 14% | -11% | -53% | -71% | $ 5,455,707.86 |
| KNB | Koonenberrygold | 0.053 | 0% | 0% | -36% | -41% | -46% | $ 4,015,091.53 |
| AWJ | Auric Mining | 0.046 | 0% | 0% | 0% | -40% | -48% | $ 6,019,541.19 |
| AZS | Azure Minerals | 0.285 | 0% | 2% | -11% | 43% | -20% | $ 111,217,280.52 |
| ENR | Encounter Resources | 0.12 | 0% | -4% | -11% | -17% | -23% | $ 42,663,093.72 |
| SNG | Siren Gold | 0.096 | 1% | -4% | -26% | -52% | -66% | $ 12,754,586.76 |
| STN | Saturn Metals | 0.175 | -8% | 25% | 9% | -33% | -53% | $ 28,794,219.56 |
| USL | Unico Silver Limited | 0.14 | 0% | 0% | 4% | -3% | -52% | $ 34,910,003.52 |
| PNM | Pacific Nickel Mines | 0.072 | 0% | -4% | 3% | -24% | -40% | $ 27,076,416.48 |
| AYM | Australia United Min | 0.003 | 0% | 0% | 0% | -50% | -50% | $ 5,527,732.46 |
| BRB | Breaker Res NL | 0.375 | -1% | 32% | 32% | 60% | 53% | $ 124,199,513.12 |
| ANL | Amani Gold Ltd | 0.001 | 0% | 0% | 0% | -33% | -50% | $ 24,693,441.13 |
| GCY | Gascoyne Res Ltd | 0.1 | 0% | -5% | -40% | -56% | -66% | $ 60,893,433.80 |
| HAV | Havilah Resources | 0.315 | -3% | -2% | -9% | -2% | 85% | $ 102,907,743.25 |
| GCY | Gascoyne Res Ltd | 0.1 | 0% | -5% | -40% | -56% | -66% | $ 60,893,433.80 |
| PNT | Panthermetalsltd | 0.145 | -3% | 32% | -24% | -28% | -29% | $ 4,612,500.00 |
| MEK | Meeka Metals Limited | 0.042 | -2% | -2% | -13% | -36% | -13% | $ 45,907,184.08 |
| GMD | Genesis Minerals | 1.02 | -2% | 1% | -6% | 6% | -31% | $ 433,786,855.76 |
| PGO | Pacgold | 0.38 | 1% | 9% | -5% | -24% | -48% | $ 20,610,680.63 |
| FEG | Far East Gold | 0.285 | -5% | -12% | -20% | -60% | 0% | $ 40,514,463.00 |
| MI6 | Minerals260Limited | 0.33 | 10% | 5% | 16% | 22% | -33% | $ 66,000,000.00 |
| IGO | IGO Limited | 12.04 | 0% | -2% | -10% | -19% | -1% | $ 9,087,213,756.00 |
| GAL | Galileo Mining Ltd | 0.695 | -1% | 13% | -14% | -41% | 231% | $ 138,337,448.90 |
| TUL | Tulla Resources | 0.27 | 2% | 15% | -2% | -42% | -55% | $ 85,278,060.53 |
| RXL | Rox Resources | 0.31 | 3% | 15% | 114% | 11% | -22% | $ 67,306,278.00 |
| KIN | KIN Min NL | 0.046 | 5% | 0% | -4% | -37% | -56% | $ 51,838,624.11 |
| CLZ | Classic Min Ltd | 0.002 | 0% | 0% | -50% | -88% | -99% | $ 3,675,563.93 |
| TGM | Theta Gold Mines Ltd | 0.05 | -17% | -23% | -22% | -28% | -63% | $ 37,140,544.38 |
| KCN | Kingsgate Consolid. | 1.76 | -3% | 11% | 14% | 17% | 20% | $ 402,803,224.46 |
| FAL | Falconmetalsltd | 0.355 | -4% | 6% | 20% | 78% | 0% | $ 65,490,000.00 |
| SXG | Southern Cross Gold | 0.69 | 5% | 11% | 5% | 146% | 0% | $ 59,285,136.90 |
| SPD | Southernpalladium | 0.51 | -2% | -3% | -20% | -52% | 0% | $ 22,400,730.04 |
| ORN | Orion Minerals Ltd | 0.012 | -14% | -27% | -29% | -29% | -52% | $ 66,574,895.25 |
The post Gold Digger: How big is that Chinese gold discovery really? appeared first on Stockhead.


Canadian Silver Co. Will See Big Changes in 2024
Source: Michael Ballanger 12/22/2023
Michael Ballanger of GGM Advisory Inc. takes a look at the current state of the market and shares on stock…
EGR options out Urban Berry project in Quebec to Harvest Gold – Richard Mills
2023.12.23
EGR Exploration Ltd. (TSXV: EGR) has moved from owner to shareholder at its Urban Berry project in Quebec, this week announcing it is optioning…
Crypto, Crude, & Crap Stocks Rally As Yield Curve Steepens, Rate-Cut Hopes Soar
Crypto, Crude, & Crap Stocks Rally As Yield Curve Steepens, Rate-Cut Hopes Soar
A weird week of macro data – strong jobless claims but…


