Precious Metals
Hydrogen-Related Platinum Demand is Gearing up to go Parabolic
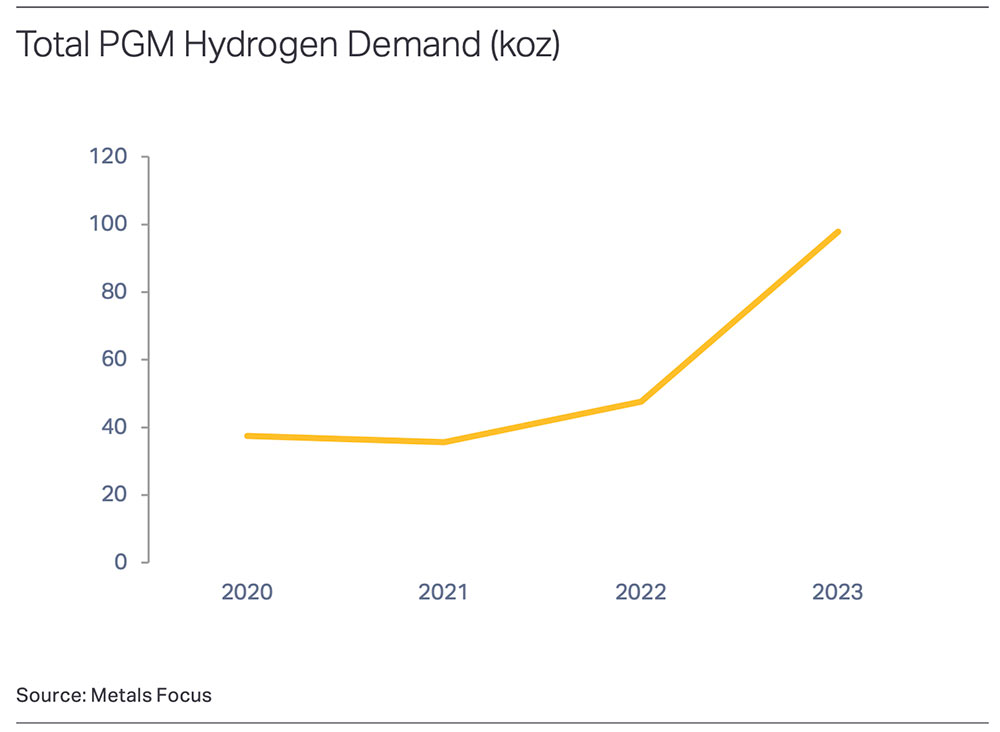
Metals Focus expects hydrogen related PGM demand to double to ~100,000oz in 2023 This mostly benefits platinum which makes up … Read More
The post Gold…

- Metals Focus expects hydrogen related PGM demand to double to ~100,000oz in 2023
- This mostly benefits platinum which makes up around two-thirds of PGM’s total usage in hydrogen
- Platinum price forecast to increase 6% on 2022 average to [US]$1,020 in 2023
Our Gold Digger column wraps all the news driving ASX stocks with exposure to precious metals.
The largest single driver of the PGM markets remains auto catalyst demand.
Three to seven grams of platinum group metals (PGMs) — mostly platinum, palladium and rhodium – go in every catalytic converter, which sit in your car exhaust to reduce polluting emissions.
Catalytic convertors account for as much as 80% of annual platinum and palladium production, respectively.
However, an accumulation of hydrogen related investment globally is beginning to impact PGM demand, with Metals Focus expecting hydrogen related offtake to hit ~100,000oz in 2023.
PGM’s are used in electrolysers and fuel cells.
While a drop in the bucket compared to total annual PGM demand of ~13Moz, expected hydrogen demand in 2023 is a doubling on 2022 demand of 48,000oz, which was a one-third increase on 2021 numbers.
The demand curve is moving in the right direction for the nascent sector:
This mostly benefits platinum which makes up around two-thirds of PGM’s total usage in hydrogen.
Part of platinum’s allure over fellow PGM’s palladium and rhodium is its outstanding oxidation and corrosion resistance, especially at high temperatures, which is particularly useful in electrolysers and fuel cells.
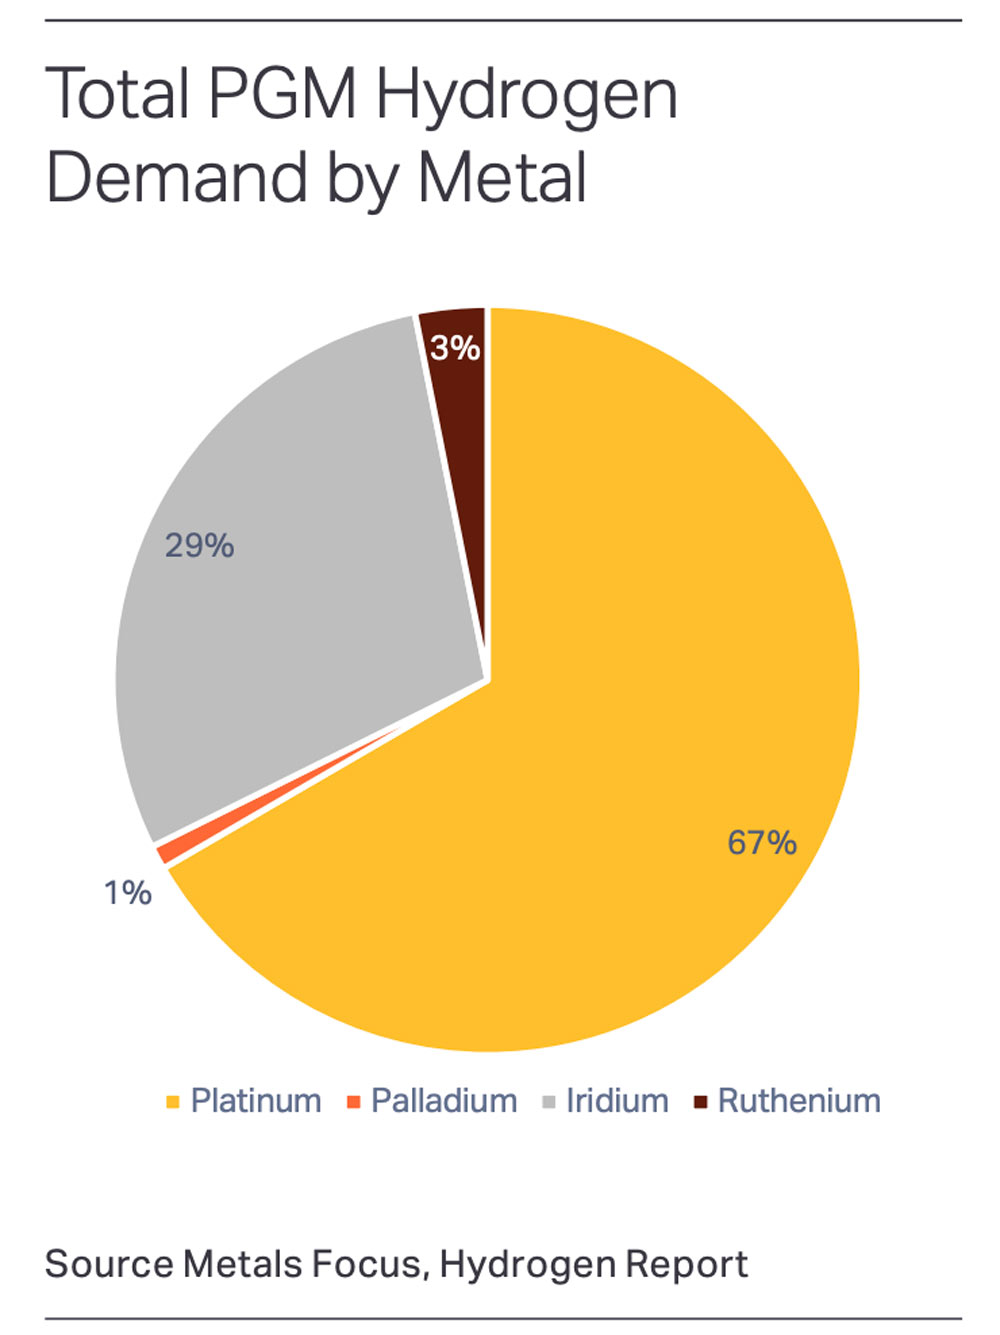
Palladium and rhodium’s relative price points also discourage their use, Metals Focus says.
“This leads to platinum hydrogen demand growing to a similar magnitude as electronics, and eclipsing this sector within a few years,” it says.
“More important, investors’ bullish attitude towards the sector, coupled with persistently strong Chinese platinum imports and a deepening physical deficit will keep the price supported.
“This is forecast to increase 6% on last year’s average to [US]$1,020 in 2023.”
Hydrogen developments moving at ‘unprecedented pace’
The hydrogen sector is young but growing fast amid a wider shift towards a greener (carbon-neutral) global economy. It is also evolving.
“One year ago, the term ‘hydrogen combustion engine’ was unfamiliar, despite the technology being around since the 1800s,” Metals Focus says.
“Today, Cummins, Toyota and Porsche all have prototypes in development as more OEMs also look towards fuel agnostic engines as part of the wider auto market electrification effort.
“This is just one example of where the industry can go.”
Winners & Losers
Here’s how ASX-listed precious metals stocks are performing:
Scroll or swipe to reveal table. Click headings to sort. Best viewed on a laptop.
Stocks missing from this list? Email [email protected]
| CODE | COMPANY | 1 WEEK RETURN % | 1 MONTH RETURN % | 6 MONTH RETURN % | 1 YEAR RETURN % | PRICE | MARKET CAP |
|---|---|---|---|---|---|---|---|
| BMO | Bastion Minerals | 95% | 145% | -44% | -62% | 0.076 | $6,026,351 |
| MEI | Meteoric Resources | 56% | 83% | 708% | 471% | 0.097 | $141,945,656 |
| BNZ | Benzmining | 35% | 30% | 46% | -4% | 0.54 | $31,950,412 |
| TRM | Truscott Mining Corp | 29% | 83% | 53% | 127% | 0.075 | $12,536,780 |
| SMS | Starmineralslimited | 27% | 33% | 3% | -56% | 0.089 | $2,632,620 |
| SKY | SKY Metals Ltd | 26% | 31% | 29% | -43% | 0.063 | $25,244,492 |
| MDI | Middle Island Res | 25% | 36% | -40% | -52% | 0.06 | $7,345,093 |
| OKR | Okapi Resources | 24% | 41% | 3% | -29% | 0.205 | $30,204,392 |
| ASO | Aston Minerals Ltd | 23% | 20% | -5% | -35% | 0.1 | $111,353,093 |
| CY5 | Cygnus Gold Limited | 21% | 16% | 191% | 182% | 0.465 | $80,904,653 |
| MCT | Metalicity Limited | 20% | -14% | 0% | -61% | 0.003 | $10,476,118 |
| CTO | Citigold Corp Ltd | 20% | 0% | 0% | -33% | 0.006 | $17,001,955 |
| PGD | Peregrine Gold | 19% | 33% | 25% | 4% | 0.53 | $22,282,336 |
| MTC | Metalstech Ltd | 17% | -1% | 56% | 91% | 0.515 | $89,488,318 |
| NWM | Norwest Minerals | 17% | 33% | 82% | -1% | 0.069 | $15,547,517 |
| DCX | Discovex Res Ltd | 17% | -13% | -22% | -63% | 0.0035 | $11,558,988 |
| RSG | Resolute Mining | 14% | 45% | 24% | 8% | 0.29 | $596,121,839 |
| AWV | Anova Metals Ltd | 13% | 6% | 42% | 0% | 0.017 | $31,641,884 |
| EM2 | Eagle Mountain | 13% | 50% | 13% | -56% | 0.255 | $77,604,097 |
| MLS | Metals Australia | 12% | 27% | 8% | 40% | 0.056 | $33,994,027 |
| PKO | Peako Limited | 12% | 27% | 12% | 6% | 0.019 | $7,205,090 |
| A1G | African Gold Ltd. | 11% | 7% | 23% | -52% | 0.091 | $13,812,993 |
| DRE | Dreadnought Resources Ltd | 10% | 7% | 74% | 193% | 0.1025 | $290,434,453 |
| GMN | Gold Mountain Ltd | 10% | -31% | 10% | -61% | 0.0055 | $11,068,995 |
| SI6 | SI6 Metals Limited | 10% | 0% | -21% | -39% | 0.0055 | $8,972,368 |
| IGO | IGO Limited | 10% | 14% | 58% | 33% | 15.725 | $12,032,985,549 |
| XTC | Xantippe Res Ltd | 9% | 9% | -25% | -40% | 0.006 | $61,752,208 |
| RDT | Red Dirt Metals Ltd | 9% | 9% | 32% | -22% | 0.5 | $230,701,895 |
| SVL | Silver Mines Limited | 9% | 11% | 35% | 9% | 0.2225 | $290,662,232 |
| BBX | BBX Minerals Ltd | 8% | 43% | 63% | -24% | 0.13 | $61,340,184 |
| WCN | White Cliff Min Ltd | 8% | 0% | 0% | -35% | 0.013 | $9,039,422 |
| VAN | Vango Mining Ltd | 8% | 33% | 30% | 30% | 0.052 | $64,256,819 |
| PDI | Predictive Disc Ltd | 8% | 8% | -9% | -13% | 0.195 | $329,768,427 |
| ARV | Artemis Resources | 8% | 4% | 0% | -61% | 0.027 | $36,176,878 |
| GBZ | GBM Rsources Ltd | 8% | 17% | -7% | -57% | 0.054 | $28,701,044 |
| TMX | Terrain Minerals | 8% | 8% | -13% | 0% | 0.007 | $5,885,899 |
| MI6 | Minerals260Limited | 7% | 4% | 24% | -37% | 0.36 | $83,600,000 |
| MKG | Mako Gold | 7% | 17% | -37% | -48% | 0.045 | $21,224,311 |
| VRC | Volt Resources Ltd | 7% | 7% | -6% | -25% | 0.015 | $54,311,934 |
| TG1 | Techgen Metals Ltd | 7% | 13% | -32% | -32% | 0.095 | $4,951,730 |
| BMR | Ballymore Resources | 7% | 3% | -16% | 0% | 0.16 | $15,410,793 |
| AM7 | Arcadia Minerals | 7% | 17% | 66% | 4% | 0.24 | $11,440,984 |
| SBR | Sabre Resources | 7% | 7% | 20% | -4% | 0.048 | $13,408,365 |
| GMR | Golden Rim Resources | 6% | 17% | -35% | -72% | 0.035 | $12,164,144 |
| PRS | Prospech Limited | 6% | 21% | 35% | -44% | 0.035 | $3,090,451 |
| HRN | Horizon Gold Ltd | 6% | 17% | -11% | -19% | 0.35 | $43,813,574 |
| CBY | Canterbury Resources | 6% | -8% | -18% | -57% | 0.036 | $5,360,941 |
| ZAG | Zuleika Gold Ltd | 6% | -5% | -10% | -47% | 0.018 | $9,414,911 |
| EMR | Emerald Res NL | 6% | 18% | 48% | 22% | 1.39 | $834,290,381 |
| WWI | West Wits Mining Ltd | 6% | 19% | -5% | -47% | 0.019 | $36,810,678 |
| LRL | Labyrinth Resources | 6% | 6% | -21% | -47% | 0.019 | $18,230,260 |
| AUC | Ausgold Limited | 5% | 28% | 40% | 28% | 0.059 | $119,738,998 |
| RGL | Riversgold | 5% | 17% | 13% | 60% | 0.0305 | $28,364,031 |
| AZS | Azure Minerals | 5% | 45% | 52% | -14% | 0.32 | $101,868,976 |
| MOH | Moho Resources | 5% | 0% | -8% | -61% | 0.022 | $4,568,568 |
| ANX | Anax Metals Ltd | 5% | 24% | -12% | -24% | 0.067 | $26,610,664 |
| KSN | Kingston Resources | 5% | 32% | 21% | -23% | 0.115 | $49,878,439 |
| NST | Northern Star | 4% | 15% | 74% | 37% | 12.675 | $14,604,307,342 |
| HMX | Hammer Metals Ltd | 4% | 9% | -11% | 37% | 0.074 | $57,498,514 |
| SMI | Santana Minerals Ltd | 4% | 12% | 4% | 171% | 0.76 | $108,607,647 |
| NAG | Nagambie Resources | 4% | -22% | -22% | 6% | 0.053 | $28,814,965 |
| LM8 | Lunnonmetalslimited | 4% | 7% | 12% | 15% | 0.985 | $109,876,127 |
| AQI | Alicanto Min Ltd | 4% | 21% | 0% | -42% | 0.057 | $24,987,963 |
| GSR | Greenstone Resources | 3% | 11% | -36% | -12% | 0.03 | $33,311,948 |
| VMC | Venus Metals Cor Ltd | 3% | 15% | -6% | -21% | 0.155 | $28,492,589 |
| AGC | AGC Ltd | 3% | 3% | -14% | -36% | 0.062 | $6,500,000 |
| AGC | AGC Ltd | 3% | 3% | -14% | -36% | 0.062 | $6,500,000 |
| XAM | Xanadu Mines Ltd | 3% | 11% | 35% | 19% | 0.031 | $45,219,950 |
| MKR | Manuka Resources. | 3% | 14% | -38% | -69% | 0.096 | $46,695,442 |
| HRZ | Horizon | 3% | 5% | -10% | -48% | 0.065 | $38,616,465 |
| KCN | Kingsgate Consolid. | 3% | 2% | 26% | -8% | 1.81 | $408,336,236 |
| KCN | Kingsgate Consolid. | 3% | 2% | 26% | -8% | 1.81 | $408,336,236 |
| SVG | Savannah Goldfields | 3% | -3% | -13% | -24% | 0.175 | $28,478,742 |
| NVA | Nova Minerals Ltd | 3% | 8% | -8% | -27% | 0.705 | $147,037,892 |
| MRZ | Mont Royal Resources | 3% | 9% | -42% | -42% | 0.185 | $11,299,640 |
| TUL | Tulla Resources | 3% | 19% | -30% | -28% | 0.38 | $80,882,411 |
| M2R | Miramar | 3% | 0% | -27% | -53% | 0.08 | $5,654,539 |
| SLR | Silver Lake Resource | 3% | 16% | 7% | -15% | 1.425 | $1,357,426,726 |
| KWR | Kingwest Resources | 2% | 26% | -34% | -75% | 0.043 | $12,114,253 |
| KZR | Kalamazoo Resources | 2% | 0% | 0% | -31% | 0.22 | $31,996,165 |
| SFR | Sandfire Resources | 2% | 18% | 55% | 1% | 6.49 | $2,919,539,420 |
| FAL | Falconmetalsltd | 2% | -4% | 8% | -45% | 0.265 | $46,905,000 |
| KIN | KIN Min NL | 2% | -13% | -34% | -50% | 0.055 | $55,571,640 |
| RND | Rand Mining Ltd | 2% | -1% | -3% | -1% | 1.39 | $81,332,624 |
| BCN | Beacon Minerals | 2% | 9% | -2% | -5% | 0.0295 | $112,703,045 |
| CMM | Capricorn Metals | 2% | 3% | 38% | 44% | 4.73 | $1,809,719,735 |
| MEK | Meeka Metals Limited | 2% | -14% | 18% | 58% | 0.06 | $60,853,709 |
| DEG | De Grey Mining | 2% | 20% | 93% | 18% | 1.535 | $2,427,614,553 |
| ENR | Encounter Resources | 1% | 8% | 28% | 19% | 0.1725 | $58,661,754 |
| SFM | Santa Fe Minerals | 1% | -6% | -12% | -59% | 0.075 | $5,461,409 |
| BC8 | Black Cat Syndicate | 1% | 22% | 24% | -28% | 0.41 | $85,720,610 |
| GOR | Gold Road Res Ltd | 1% | 0% | 41% | 20% | 1.7075 | $1,867,069,683 |
| MRR | Minrex Resources Ltd | 0% | 15% | 6% | -31% | 0.038 | $40,140,098 |
| NPM | Newpeak Metals | 0% | 0% | 0% | -33% | 0.001 | $9,145,132 |
| FFX | Firefinch Ltd | 0% | 0% | 0% | -13% | 0.2 | $236,248,644 |
| GED | Golden Deeps | 0% | 0% | -23% | -9% | 0.01 | $11,552,267 |
| AQX | Alice Queen Ltd | 0% | 25% | -29% | -72% | 0.0025 | $4,400,500 |
| IVR | Investigator Res Ltd | 0% | 13% | 5% | -27% | 0.045 | $66,109,528 |
| IPT | Impact Minerals | 0% | 43% | 33% | -21% | 0.01 | $27,295,076 |
| SRN | Surefire Rescs NL | 0% | 25% | -17% | 36% | 0.015 | $23,720,452 |
| SIH | Sihayo Gold Limited | 0% | 0% | -20% | -78% | 0.002 | $12,204,256 |
| AVM | Advance Metals Ltd | 0% | 33% | 9% | -29% | 0.012 | $6,960,529 |
| AME | Alto Metals Limited | 0% | 4% | 9% | -20% | 0.07 | $42,897,084 |
| GRL | Godolphin Resources | 0% | 27% | -13% | -23% | 0.1 | $11,836,945 |
| TRY | Troy Resources Ltd | 0% | 0% | 0% | 0% | 0.0295 | $62,920,961 |
| CGN | Crater Gold Min Ltd | 0% | 0% | 0% | 0% | 0.017 | $21,063,474 |
| EMC | Everest Metals Corp | 0% | 24% | 41% | -29% | 0.099 | $10,536,878 |
| NAE | New Age Exploration | 0% | 0% | 0% | -43% | 0.008 | $11,487,191 |
| VKA | Viking Mines Ltd | 0% | -11% | 0% | -43% | 0.008 | $8,202,067 |
| RMX | Red Mount Min Ltd | 0% | 11% | -23% | -55% | 0.005 | $9,941,744 |
| RXL | Rox Resources | 0% | 11% | -25% | -60% | 0.195 | $42,353,580 |
| MAU | Magnetic Resources | 0% | -4% | -18% | -45% | 0.8 | $182,462,343 |
| BYH | Bryah Resources Ltd | 0% | 4% | -19% | -53% | 0.025 | $7,031,337 |
| HCH | Hot Chili Ltd | 0% | 18% | 42% | -38% | 0.97 | $118,250,754 |
| MEU | Marmota Limited | 0% | 5% | -4% | 2% | 0.046 | $48,704,826 |
| RML | Resolution Minerals | 0% | 13% | 0% | -40% | 0.009 | $9,717,716 |
| AL8 | Alderan Resource Ltd | 0% | 29% | -25% | -65% | 0.009 | $5,204,395 |
| TBA | Tombola Gold Ltd | 0% | 0% | -16% | -4% | 0.026 | $33,129,243 |
| BM8 | Battery Age Minerals | 0% | 0% | 0% | 32% | 0.5 | $28,984,082 |
| TBR | Tribune Res Ltd | 0% | -2% | 1% | -15% | 3.94 | $206,724,223 |
| FML | Focus Minerals Ltd | 0% | -10% | 46% | -27% | 0.19 | $53,013,349 |
| QML | Qmines Limited | 0% | 19% | 3% | -31% | 0.185 | $16,688,671 |
| TCG | Turaco Gold Limited | 0% | 2% | -9% | -51% | 0.059 | $26,518,433 |
| DTM | Dart Mining NL | 0% | 2% | -21% | -38% | 0.055 | $8,559,131 |
| RVR | Red River Resources | 0% | 0% | -46% | -58% | 0.073 | $37,847,908 |
| TMZ | Thomson Res Ltd | 0% | 5% | -13% | -73% | 0.02 | $16,565,687 |
| WMC | Wiluna Mining Corp | 0% | 0% | 0% | -78% | 0.205 | $74,238,031 |
| THR | Thor Energy PLC | 0% | 0% | -40% | -50% | 0.006 | $8,731,877 |
| POL | Polymetals Resources | 0% | -20% | 30% | 50% | 0.195 | $8,810,625 |
| RDS | Redstone Resources | 0% | 25% | 25% | -23% | 0.01 | $7,368,324 |
| EVN | Evolution Mining Ltd | 0% | 9% | 36% | -17% | 3.24 | $5,890,402,384 |
| CXU | Cauldron Energy Ltd | 0% | -7% | -20% | -67% | 0.007 | $6,520,976 |
| AVW | Avira Resources Ltd | 0% | 0% | 0% | -40% | 0.003 | $6,401,370 |
| LCY | Legacy Iron Ore | 0% | -6% | -11% | -15% | 0.017 | $108,916,045 |
| SAU | Southern Gold | 0% | 13% | -18% | -54% | 0.027 | $8,107,703 |
| CEL | Challenger Exp Ltd | 0% | -3% | -8% | -39% | 0.175 | $183,017,632 |
| CHZ | Chesser Resources | 0% | 13% | 7% | -13% | 0.096 | $56,505,729 |
| WGX | Westgold Resources. | 0% | 39% | 1% | -40% | 1.2 | $565,979,162 |
| MBK | Metal Bank Ltd | 0% | 18% | -11% | -33% | 0.04 | $11,059,421 |
| NES | Nelson Resources. | 0% | 0% | -21% | -62% | 0.008 | $4,120,160 |
| TLM | Talisman Mining | 0% | 26% | 17% | 6% | 0.17 | $30,977,017 |
| ICG | Inca Minerals Ltd | 0% | 9% | -62% | -72% | 0.025 | $11,105,628 |
| DEX | Duke Exploration | 0% | 0% | -24% | -66% | 0.053 | $5,587,240 |
| SNG | Siren Gold | 0% | 0% | -38% | -33% | 0.175 | $20,461,958 |
| BRB | Breaker Res NL | 0% | 6% | 74% | 45% | 0.34 | $111,063,130 |
| ANL | Amani Gold Ltd | 0% | -33% | -50% | -50% | 0.001 | $24,693,441 |
| GCY | Gascoyne Res Ltd | 0% | 0% | -22% | -28% | 0.195 | $83,082,880 |
| PNT | Panthermetalsltd | 0% | -3% | -13% | -20% | 0.195 | $5,996,250 |
| PGO | Pacgold | 0% | 0% | -38% | -54% | 0.36 | $20,061,062 |
| RXL | Rox Resources | 0% | 11% | -25% | -60% | 0.195 | $42,353,580 |
| CLZ | Classic Min Ltd | 0% | 11% | -73% | -93% | 0.01 | $7,066,109 |
| NCM | Newcrest Mining | 0% | 8% | 20% | -8% | 22.49 | $20,510,617,465 |
| YRL | Yandal Resources | -1% | 2% | -35% | -72% | 0.098 | $15,464,702 |
| RRL | Regis Resources | -1% | 5% | 38% | 24% | 2.175 | $1,713,908,850 |
| RMS | Ramelius Resources | -1% | 13% | 6% | -31% | 1.0525 | $915,911,105 |
| AAR | Astral Resources NL | -1% | 7% | -1% | -33% | 0.073 | $52,567,388 |
| GML | Gateway Mining | -1% | 8% | -24% | -51% | 0.068 | $15,368,745 |
| GAL | Galileo Mining Ltd | -2% | 6% | -19% | 339% | 0.9 | $181,814,933 |
| IDA | Indiana Resources | -2% | 2% | 9% | -5% | 0.059 | $29,058,280 |
| SSR | SSR Mining Inc. | -2% | 2% | 6% | 3% | 23.97 | $445,732,650 |
| NSM | Northstaw | -2% | 59% | 39% | -22% | 0.23 | $27,629,210 |
| RED | Red 5 Limited | -2% | 15% | -2% | -15% | 0.23 | $670,276,011 |
| MEG | Megado Minerals Ltd | -2% | -2% | -44% | -51% | 0.044 | $6,050,000 |
| GBR | Greatbould Resources | -2% | -5% | 6% | -36% | 0.087 | $37,102,452 |
| KAL | Kalgoorliegoldmining | -2% | -8% | -48% | -41% | 0.083 | $6,427,072 |
| STK | Strickland Metals | -3% | -5% | -36% | -34% | 0.038 | $54,604,480 |
| MAT | Matsa Resources | -3% | -10% | -14% | -37% | 0.036 | $16,068,180 |
| ADT | Adriatic Metals | -3% | -4% | 76% | 32% | 3.21 | $718,149,871 |
| STN | Saturn Metals | -3% | -8% | -36% | -51% | 0.175 | $28,016,867 |
| TGM | Theta Gold Mines Ltd | -3% | 3% | 30% | -59% | 0.07 | $39,616,581 |
| SXG | Southern Cross Gold | -3% | -10% | 100% | 0% | 0.7 | $64,674,695 |
| SVY | Stavely Minerals Ltd | -3% | 17% | 61% | -50% | 0.2575 | $83,059,548 |
| DTR | Dateline Resources | -3% | -11% | -60% | -60% | 0.034 | $20,346,643 |
| WRM | White Rock Min Ltd | -3% | 2% | -33% | -70% | 0.067 | $17,443,590 |
| ALY | Alchemy Resource Ltd | -3% | -25% | -3% | 38% | 0.0165 | $18,849,220 |
| S2R | S2 Resources | -3% | 0% | 18% | -13% | 0.165 | $62,453,100 |
| ZNC | Zenith Minerals Ltd | -3% | -4% | -20% | -26% | 0.245 | $87,926,511 |
| SPQ | Superior Resources | -3% | 20% | 41% | 44% | 0.065 | $115,682,988 |
| AGG | AngloGold Ashanti | -3% | 4% | 50% | 14% | 6.1 | $557,548,531 |
| X64 | Ten Sixty Four Ltd | -3% | 2% | -2% | -2% | 0.64 | $150,739,579 |
| ARL | Ardea Resources Ltd | -3% | 1% | -33% | 44% | 0.79 | $138,059,731 |
| GIB | Gibb River Diamonds | -3% | 9% | 43% | -10% | 0.063 | $14,171,133 |
| CST | Castile Resources | -3% | 3% | -36% | -50% | 0.093 | $22,496,926 |
| GWR | GWR Group Ltd | -3% | -3% | -38% | -67% | 0.06 | $19,272,999 |
| E2M | E2 Metals | -3% | -14% | 0% | -44% | 0.15 | $30,865,510 |
| CYL | Catalyst Metals | -4% | 17% | 5% | -25% | 1.35 | $131,931,238 |
| TIE | Tietto Minerals | -4% | 9% | 62% | 55% | 0.76 | $842,833,805 |
| G88 | Golden Mile Res Ltd | -4% | 14% | -7% | -52% | 0.025 | $4,910,154 |
| MVL | Marvel Gold Limited | -4% | -4% | -11% | -61% | 0.024 | $16,203,371 |
| CWX | Carawine Resources | -4% | 26% | 25% | -27% | 0.12 | $23,618,096 |
| LEX | Lefroy Exploration | -4% | -4% | -17% | -30% | 0.24 | $38,965,127 |
| KAI | Kairos Minerals Ltd | -4% | 9% | -4% | -4% | 0.024 | $47,138,244 |
| PRU | Perseus Mining Ltd | -4% | 3% | 41% | 50% | 2.255 | $3,117,815,898 |
| CPM | Coopermetalslimited | -4% | 0% | -53% | -21% | 0.23 | $10,049,900 |
| TAR | Taruga Minerals | -4% | -4% | -4% | -44% | 0.023 | $15,532,589 |
| BTR | Brightstar Resources | -4% | 28% | 15% | -66% | 0.023 | $21,557,349 |
| DCN | Dacian Gold Ltd | -4% | 10% | 10% | -39% | 0.11 | $139,932,108 |
| MGV | Musgrave Minerals | -4% | 8% | -12% | -27% | 0.215 | $130,065,749 |
| LCL | Los Cerros Limited | -4% | -16% | 30% | -63% | 0.043 | $30,775,691 |
| TAM | Tanami Gold NL | -4% | 8% | -19% | -26% | 0.043 | $50,529,173 |
| GSM | Golden State Mining | -4% | -2% | -12% | -55% | 0.043 | $5,031,611 |
| NXM | Nexus Minerals Ltd | -5% | 5% | 0% | -36% | 0.21 | $69,972,461 |
| HAW | Hawthorn Resources | -5% | -11% | 25% | 17% | 0.105 | $35,176,639 |
| AXE | Archer Materials | -5% | 6% | -13% | -38% | 0.63 | $158,094,176 |
| KTA | Krakatoa Resources | -5% | -7% | -16% | -21% | 0.042 | $13,788,397 |
| AAU | Antilles Gold Ltd | -5% | 46% | -33% | -45% | 0.041 | $19,492,425 |
| NML | Navarre Minerals Ltd | -5% | 8% | -21% | -51% | 0.041 | $58,953,045 |
| FG1 | Flynngold | -5% | 0% | 0% | -35% | 0.1 | $8,028,163 |
| MXR | Maximus Resources | -5% | -3% | -15% | -44% | 0.039 | $12,443,175 |
| MM8 | Medallion Metals. | -5% | -6% | -22% | -36% | 0.145 | $20,993,259 |
| KNB | Koonenberrygold | -5% | -8% | -30% | -59% | 0.057 | $4,318,117 |
| GMD | Genesis Minerals | -5% | 2% | 1% | -12% | 1.29 | $535,827,499 |
| CAZ | Cazaly Resources | -6% | 3% | -20% | -22% | 0.032 | $11,898,297 |
| TSO | Tesoro Gold Ltd | -6% | 0% | -15% | -58% | 0.032 | $36,332,315 |
| HXG | Hexagon Energy | -6% | -6% | -6% | -76% | 0.016 | $7,693,739 |
| ALK | Alkane Resources Ltd | -6% | 15% | -7% | -19% | 0.655 | $404,185,000 |
| BGL | Bellevue Gold Ltd | -7% | 6% | 60% | 58% | 1.215 | $1,411,348,524 |
| REZ | Resourc & En Grp Ltd | -7% | -22% | -39% | -73% | 0.014 | $6,997,281 |
| GSN | Great Southern | -7% | -7% | -23% | -48% | 0.028 | $16,569,195 |
| KRM | Kingsrose Mining Ltd | -7% | 8% | 30% | -5% | 0.07 | $53,429,383 |
| CHN | Chalice Mining Ltd | -7% | 1% | 41% | -14% | 6.205 | $2,443,142,289 |
| ERM | Emmerson Resources | -7% | 5% | -19% | -30% | 0.081 | $44,121,493 |
| HMG | Hamelingoldlimited | -7% | -10% | 23% | -21% | 0.135 | $14,850,000 |
| PNM | Pacific Nickel Mines | -7% | -2% | 9% | -19% | 0.081 | $31,213,091 |
| KAU | Kaiser Reef | -7% | 18% | 8% | -3% | 0.195 | $24,748,860 |
| A8G | Australasian Metals | -7% | -12% | -22% | -63% | 0.19 | $8,028,246 |
| KCC | Kincora Copper | -7% | 26% | 24% | -32% | 0.088 | $9,352,482 |
| CDR | Codrus Minerals Ltd | -7% | 4% | 56% | 9% | 0.125 | $5,255,900 |
| FEG | Far East Gold | -8% | -13% | 21% | 0% | 0.425 | $60,771,695 |
| BNR | Bulletin Res Ltd | -8% | 9% | -22% | -3% | 0.097 | $28,184,746 |
| PRX | Prodigy Gold NL | -8% | 0% | -4% | -56% | 0.012 | $20,974,594 |
| CDT | Castle Minerals | -8% | 0% | -15% | -38% | 0.023 | $21,988,846 |
| RDN | Raiden Resources Ltd | -8% | 10% | -31% | -73% | 0.0055 | $8,272,912 |
| ARN | Aldoro Resources | -9% | 17% | 11% | -32% | 0.21 | $23,711,587 |
| M24 | Mamba Exploration | -9% | 50% | 141% | 0% | 0.21 | $8,645,876 |
| PUA | Peak Minerals Ltd | -9% | -9% | -44% | -64% | 0.005 | $5,206,883 |
| PNR | Pantoro Limited | -9% | 10% | -50% | -67% | 0.1 | $195,670,263 |
| AMI | Aurelia Metals Ltd | -9% | 7% | -41% | -64% | 0.145 | $179,428,396 |
| CLA | Celsius Resource Ltd | -10% | 19% | 12% | -32% | 0.019 | $31,156,581 |
| AUT | Auteco Minerals | -10% | 21% | 36% | -26% | 0.057 | $116,078,833 |
| FAU | First Au Ltd | -10% | 13% | -55% | -55% | 0.0045 | $4,283,970 |
| BAT | Battery Minerals Ltd | -10% | 29% | -25% | -63% | 0.0045 | $11,740,969 |
| MOM | Moab Minerals Ltd | -10% | 13% | -67% | -60% | 0.009 | $6,819,635 |
| AWJ | Auric Mining | -10% | -14% | -33% | -55% | 0.054 | $5,255,299 |
| LYN | Lycaonresources | -10% | -12% | 4% | -32% | 0.26 | $8,558,875 |
| WAF | West African Res Ltd | -10% | -2% | -4% | 8% | 1.1425 | $1,202,551,683 |
| TTM | Titan Minerals | -11% | -3% | 35% | -27% | 0.073 | $105,845,489 |
| PNX | PNX Metals Limited | -11% | 0% | 0% | -33% | 0.004 | $17,776,231 |
| ADN | Andromeda Metals Ltd | -11% | 30% | -44% | -71% | 0.056 | $174,160,472 |
| SBM | St Barbara Limited | -11% | -4% | -18% | -43% | 0.74 | $571,579,152 |
| ICL | Iceni Gold | -12% | 22% | 25% | 0% | 0.115 | $14,101,607 |
| BEZ | Besragoldinc | -12% | -7% | 14% | -61% | 0.046 | $16,985,371 |
| OZM | Ozaurum Resources | -12% | 7% | -40% | -42% | 0.075 | $5,228,700 |
| PUR | Pursuit Minerals | -12% | 47% | 29% | -8% | 0.022 | $25,136,097 |
| AAJ | Aruma Resources Ltd | -12% | 49% | 39% | 5% | 0.085 | $13,027,805 |
| ADV | Ardiden Ltd | -13% | -7% | 0% | -53% | 0.007 | $20,162,515 |
| MTH | Mithril Resources | -13% | 17% | -36% | -73% | 0.0035 | $11,420,816 |
| EMU | EMU NL | -13% | 0% | -36% | -65% | 0.007 | $4,810,877 |
| OAU | Ora Gold Limited | -13% | -13% | -36% | -56% | 0.007 | $6,889,619 |
| GNM | Great Northern | -13% | -13% | -22% | -42% | 0.0035 | $5,127,153 |
| GUL | Gullewa Limited | -13% | -13% | -13% | -25% | 0.052 | $10,180,201 |
| MZZ | Matador Mining Ltd | -14% | -14% | -17% | -67% | 0.1075 | $33,097,978 |
| OBM | Ora Banda Mining Ltd | -14% | 6% | 89% | 60% | 0.085 | $116,914,963 |
| MHC | Manhattan Corp Ltd | -14% | 9% | -25% | -60% | 0.006 | $10,683,951 |
| GTR | Gti Energy Ltd | -15% | 0% | -27% | -48% | 0.011 | $16,560,319 |
| HAV | Havilah Resources | -15% | 15% | 42% | 109% | 0.355 | $118,739,704 |
| ASR | Asra Minerals Ltd | -16% | -6% | -24% | -45% | 0.016 | $23,473,899 |
| NMR | Native Mineral Res | -16% | -25% | -45% | -60% | 0.083 | $11,218,035 |
| SLZ | Sultan Resources Ltd | -16% | -11% | -20% | -54% | 0.076 | $6,329,614 |
| BGD | Bartongoldholdings | -18% | 10% | 15% | 5% | 0.23 | $19,835,730 |
| AYM | Australia United Min | -20% | 33% | -20% | -43% | 0.004 | $7,370,310 |
| G50 | Gold50Limited | -20% | -30% | 35% | -20% | 0.175 | $11,388,600 |
| ADG | Adelong Gold Limited | -28% | 86% | -35% | -57% | 0.013 | $7,473,512 |
| CAI | Calidus Resources | -28% | 6% | -54% | -58% | 0.2875 | $169,101,690 |
The post Gold Digger: Hydrogen-related platinum demand is gearing up to go parabolic appeared first on Stockhead.


Canadian Silver Co. Will See Big Changes in 2024
Source: Michael Ballanger 12/22/2023
Michael Ballanger of GGM Advisory Inc. takes a look at the current state of the market and shares on stock…
EGR options out Urban Berry project in Quebec to Harvest Gold – Richard Mills
2023.12.23
EGR Exploration Ltd. (TSXV: EGR) has moved from owner to shareholder at its Urban Berry project in Quebec, this week announcing it is optioning…
Crypto, Crude, & Crap Stocks Rally As Yield Curve Steepens, Rate-Cut Hopes Soar
Crypto, Crude, & Crap Stocks Rally As Yield Curve Steepens, Rate-Cut Hopes Soar
A weird week of macro data – strong jobless claims but…


