Disclaimer: opinions are personal to the author and do not reflect the opinions of Exness or LeapRate.
Precious Metals
Oil and Gold Price Action Before NFP & FOMC
On the technical side the price has recently broken above the resistances of the 38.2% of the daily Fibonacci retracement level, the 50 and 100 moving…
On the technical side the price has recently broken above the resistances of the 38.2% of the daily Fibonacci retracement level, the 50 and 100 moving averages as well as the bearish symmetrical triangle formation that was in effect since mid November 2022. This major correction to the upside was somewhat “paused” (at the time of this report) after the concerns of investors mentioned above.
In the event of a continuation of the bullish momentum then we might expect some resistance around the $80,50 area which is the upper band of the Bollinger bands and slightly above the psychological resistance of the round number. If the opposite happens and the price resumes its overall bearish movement then the first level of support lies around $77,50 which consists of an area on the chart where there are the 50 and 100 moving averages as well as the upper boundary of the triangle.
Gold-dollar, daily
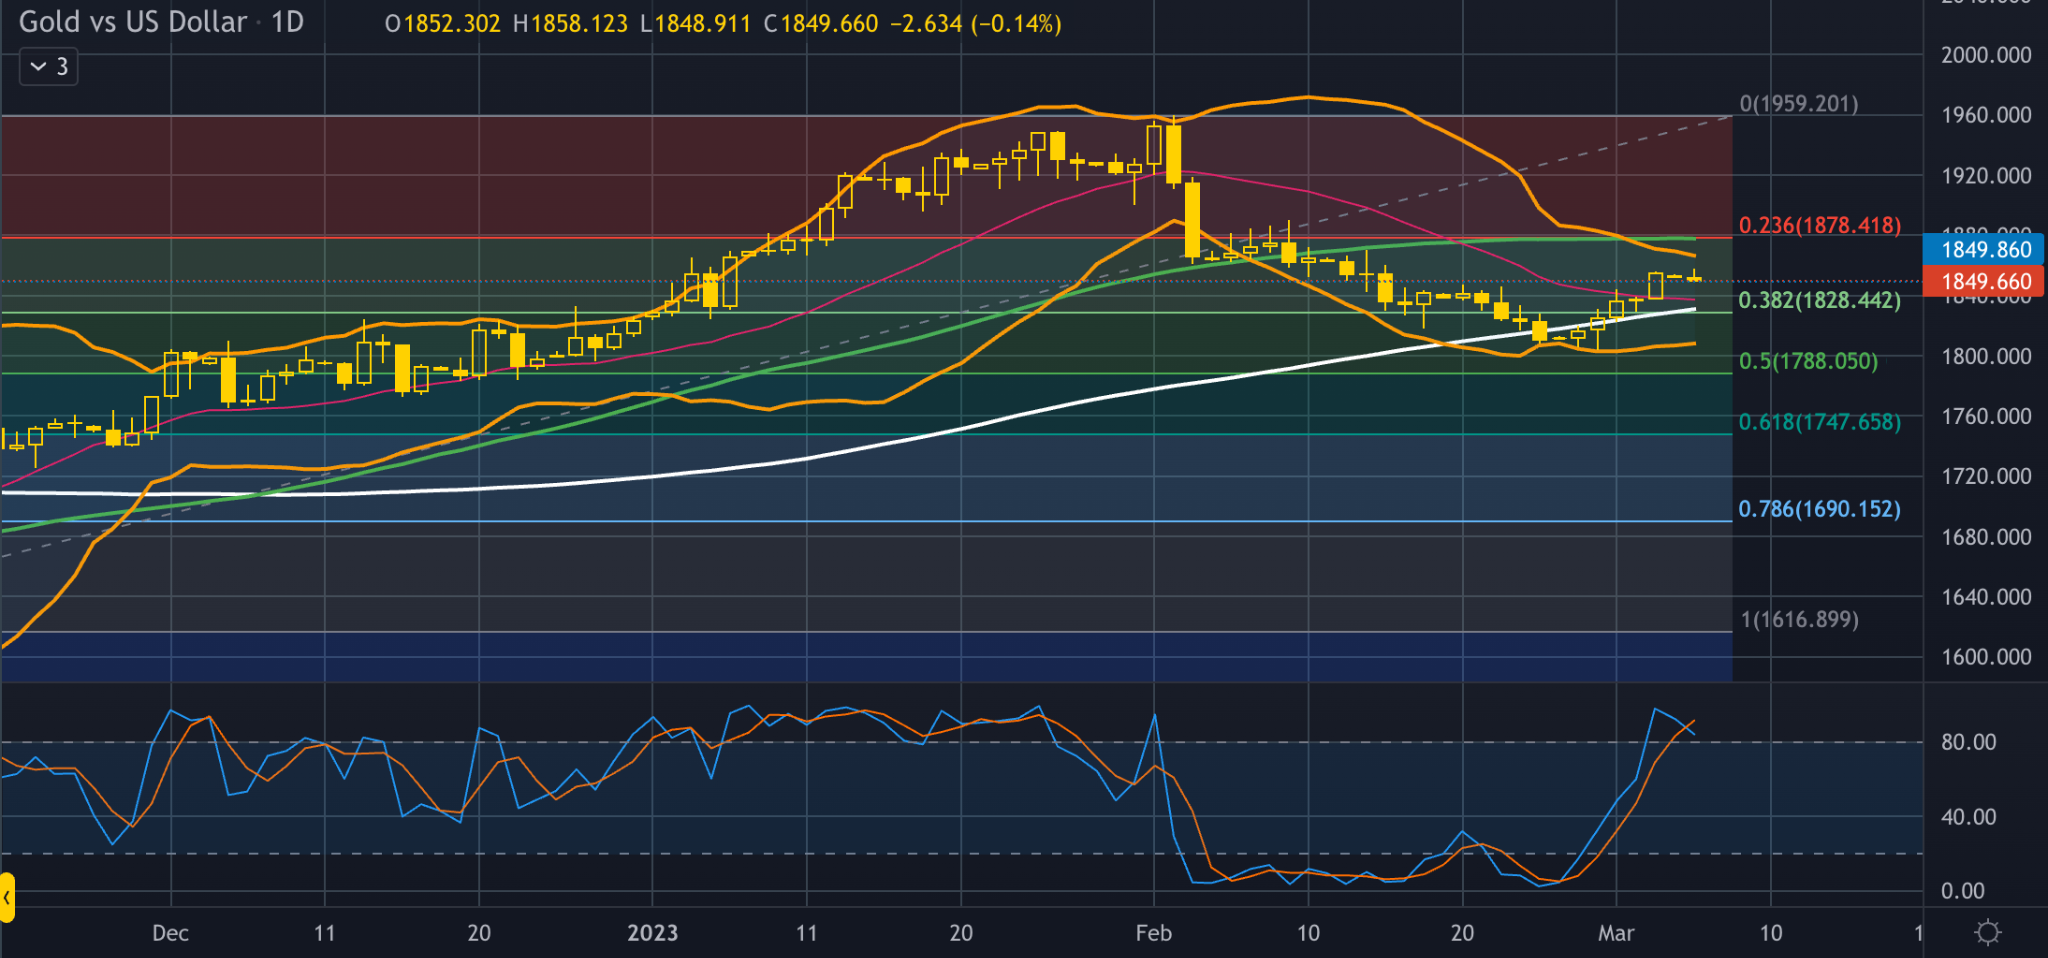
Past week’s economic data from the US came in softer especially for PMI boosting the price of the yellow metal. According to FedWatchTool from CME group, the market is discounting the possibility of a single hike on the next FED meeting on 22nd of March at more than 70% but the scenario of a double hike is silently gaining ground since it was around 9% one month ago and today is more than 27%. The NFP set to be published on the 10th of March is expected to create volatility on all USD pairs , gold included.
From the technical point of view the price is trading in a “dynamic area” which is the area between the 50 and the 100 moving average. While the Stochastic oscillator is in the overbought area we might witness a small correction to the downside while a better than expected figure on the NFP would reinforce the possibility of further losses for the commodity. The $1,830 area is considered a strong technical support for the price since it consists of the 20 and 100 moving averages, the 38.2% of the daily Fibonacci retracement level and also the psychological support of the round number.
On the other hand a continuation of the short term bullish movement could face some resistance around the $1,880 price area which is made up of a point on the chart where the 50 day moving average meets the 23.6% of the Fibonacci retracement making it a valid technical resistance level.
If you want to learn more about what is moving the markets, join our monthly live analysis and trading session this coming Monday. Register here.
The post Weekly data: Oil and Gold price action before NFP appeared first on LeapRate.


Canadian Silver Co. Will See Big Changes in 2024
Source: Michael Ballanger 12/22/2023
Michael Ballanger of GGM Advisory Inc. takes a look at the current state of the market and shares on stock…
EGR options out Urban Berry project in Quebec to Harvest Gold – Richard Mills
2023.12.23
EGR Exploration Ltd. (TSXV: EGR) has moved from owner to shareholder at its Urban Berry project in Quebec, this week announcing it is optioning…
Crypto, Crude, & Crap Stocks Rally As Yield Curve Steepens, Rate-Cut Hopes Soar
Crypto, Crude, & Crap Stocks Rally As Yield Curve Steepens, Rate-Cut Hopes Soar
A weird week of macro data – strong jobless claims but…


